Dashboard
With HIgh Debt (Debt-Equity Ratio at 12.48 times)- the company has a Weak Long Term Fundamental Strength
- Poor long term growth as Net Sales has grown by an annual rate of 68.95% over the last 5 years
- High Debt Company with a Debt to Equity ratio (avg) at 0 times
Stock is technically in a Mildly Bearish range
Stock DNA
Garments & Apparels
INR 90 Cr (Micro Cap)
38.00
24
0.00%
12.48
23.81%
19.91
Total Returns (Price + Dividend) 
Digjam for the last several years.
Risk Adjusted Returns v/s
Returns Beta

News
When is the next results date for Digjam Ltd?
The next results date for Digjam Ltd is scheduled for 23 May 2026....
Read More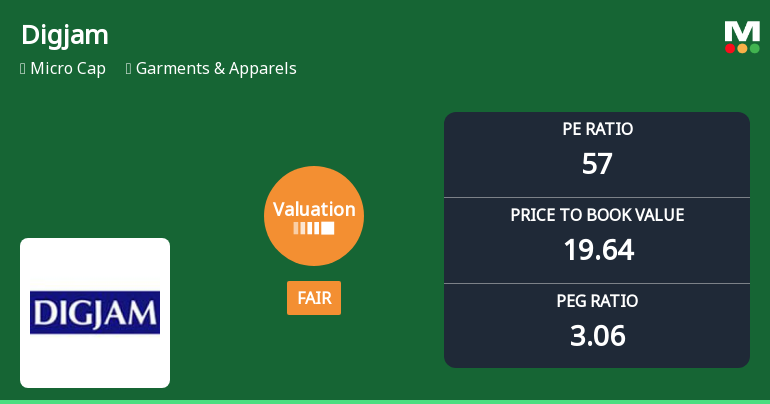
Digjam Ltd Valuation Shifts to Fair Amid Mixed Market Performance
Digjam Ltd, a micro-cap player in the Garments & Apparels sector, has seen a notable shift in its valuation parameters, moving from an expensive to a fair valuation grade. This article analyses the recent changes in key valuation metrics such as the price-to-earnings (P/E) ratio and price-to-book value (P/BV), comparing them with historical averages and peer benchmarks to assess the stock’s price attractiveness and investment potential.
Read More
Digjam Ltd Upgraded to Sell: A Detailed Analysis of Quality, Valuation, Financial Trend, and Technicals
Digjam Ltd, a micro-cap player in the garments and apparels sector, has seen its investment rating upgraded from Strong Sell to Sell as of 11 May 2026. This change reflects a nuanced shift in the company’s technical outlook amid persistent valuation and fundamental challenges. While technical indicators have improved to a sideways trend, valuation metrics suggest the stock remains expensive relative to peers, warranting cautious investor consideration.
Read More Announcements
Compliances-Reg.24(A)-Annual Secretarial Compliance
26-May-2026 | Source : BSEPlease find enclosed Annual Secretarial Compliance Report of the Company for the year ended March 31 2026.
Announcement under Regulation 30 (LODR)-Newspaper Publication
25-May-2026 | Source : BSEDigjam Limited has informed the Stock Exchange about copy of Newspaper Publication For Financial Results for the Quarter and Year Ended March 31 2026.
Financial Results For The The Quarter And Year Ended March 31 2026
23-May-2026 | Source : BSEFinancial Results for the the quarter and year ended March 31 2026
Corporate Actions

No Upcoming Board Meetings

No Dividend history available

No Splits history available

No Bonus history available

No Rights history available
Quality key factors
Valuation key factors
Technicals key factors
 Technical Indicator Scale: Bearish, Mildly Bearish, Sideways, Mildly Bullish, Bullish Turned
 Shareholding Snapshot : Mar 2026
Shareholding Compare (%holding)
Promoters
None
Held by 2 Schemes (0.0%)
Held by 12 FIIs (1.79%)
Finquest Financial Solutions Pvt. Ltd. (75.0%)
Icici Bank Ltd (1.22%)
17.51%
Quarterly Results Snapshot (Standalone) - Mar'26 - YoY

YoY Growth in quarter ended Mar 2026 is 32.85% vs 108.08% in Mar 2025
YoY Growth in quarter ended Mar 2026 is -120.00% vs 248.98% in Mar 2025
Half Yearly Results Snapshot (Standalone) - Sep'25

Growth in half year ended Sep 2025 is 171.62% vs -52.97% in Sep 2024
Growth in half year ended Sep 2025 is 95.41% vs -116.58% in Sep 2024
Nine Monthly Results Snapshot (Standalone) - Dec'25
YoY Growth in nine months ended Dec 2025 is 108.74% vs -39.77% in Dec 2024
YoY Growth in nine months ended Dec 2025 is 98.25% vs -60.04% in Dec 2024
Annual Results Snapshot (Standalone) - Mar'26
YoY Growth in year ended Mar 2026 is 82.86% vs 619.37% in Mar 2025
YoY Growth in year ended Mar 2026 is 90.57% vs 12.11% in Mar 2025
About Digjam Ltd


