
 Upcoming Result: Dhruva Cap.Serv. will declare its result soon on 13 Aug 202652-Week Low: Rs.95.2 hit today
 Mojo Parameters
Stock DNA

Non Banking Financial Company (NBFC)

INR 68 Cr (Micro Cap)

171.00
21

0.00%

0.20

-11.73%

2.33
Total ReturnsTotal Returns (Price + Dividend) 
Dhruva Cap.Serv. for the last several years.
Risk Adjusted Returns v/s
Returns Beta
 News & Corporate Actions
News
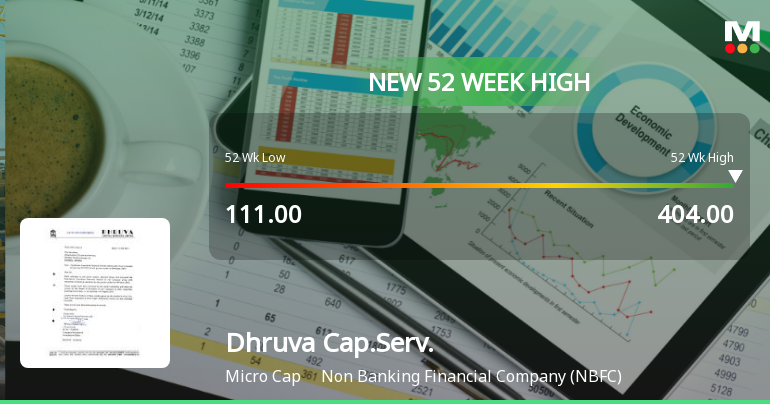
Broad-Based Technical Strength Lifts Dhruva Capital Services Ltd to 52-Week High of Rs 404
Surging past its previous peak, Dhruva Capital Services Ltd touched a fresh 52-week high of Rs 404 on 20 May 2026, marking a remarkable rally from its 52-week low of Rs 111. This milestone caps a sustained uptrend fuelled by robust technical momentum and a string of positive price signals across multiple timeframes.
Read More
Broad-Based Technical Strength Lifts Dhruva Capital Services Ltd to 52-Week High of Rs 393
From a 52-week low of Rs 111 to a fresh high of Rs 393 on 19 May 2026, Dhruva Capital Services Ltd has surged an impressive 129.02% over the past year, vastly outperforming the Sensex’s decline of 7.95%. This milestone reflects a powerful momentum build-up, underpinned by a confluence of technical indicators signalling sustained strength.
Read More
Broad-Based Technical Strength Lifts Dhruva Capital Services Ltd to 52-Week High of Rs 378.75
With a remarkable ascent from Rs 111 to Rs 378.75 over the past year, Dhruva Capital Services Ltd has surged 158.53%, vastly outperforming the Sensex’s decline of 7.96%. This milestone 52-week high, reached on 13 May 2026, reflects a powerful convergence of technical momentum and sustained price strength.
Read More Announcements
Board Meeting Intimation for Unaudited Financial Results Of The Company For The Quarter Ended June 30 2026.
06-Aug-2026 | Source : BSEClarification On Movement In Price.
21-Jul-2026 | Source : BSEClarification on Movement in Price.
Clarification sought from Dhruva Capital Services Ltd
20-Jul-2026 | Source : BSEThe Exchange has sought clarification from Dhruva Capital Services Ltd on July 20 2026 with reference to significant movement in price in order to ensure that investors have latest relevant information about the company and to inform the market so that the interest of the investors is safeguarded.
The reply is awaited.
Corporate Actions

13 Aug 2026

No Dividend history available

No Splits history available

No Bonus history available

No Rights history available
Key FactorsQuality key factors
Valuation key factors
Technicals key factors
Technical Indicator Scale: Bearish, Mildly Bearish, Sideways, Mildly Bullish, Bullish Turned ShareholdingShareholding Snapshot : Jun 2026
Shareholding Compare (%holding)
Non Institution
32.6708
Held by 0 Schemes
Held by 0 FIIs
Shreeram Bagla (30.32%)
Kadayam Ramanathan Bharat (5.7%)
40.93%
FinancialQuarterly Results Snapshot (Standalone) - Mar'26 - QoQ
 Compare with Peers
QoQ Growth in quarter ended Mar 2026 is 28.36% vs -14.10% in Dec 2025

QoQ Growth in quarter ended Mar 2026 is -155.48% vs 269.77% in Dec 2025

Half Yearly Results Snapshot (Standalone) - Sep'25
Growth in half year ended Sep 2025 is 53.40% vs 123.91% in Sep 2024
Growth in half year ended Sep 2025 is -257.30% vs -13.59% in Sep 2024
Nine Monthly Results Snapshot (Standalone) - Dec'25
YoY Growth in nine months ended Dec 2025 is 36.36% vs 111.54% in Dec 2024
YoY Growth in nine months ended Dec 2025 is -93.81% vs -24.81% in Dec 2024
Annual Results Snapshot (Standalone) - Mar'26
YoY Growth in year ended Mar 2026 is 46.01% vs 85.22% in Mar 2025
YoY Growth in year ended Mar 2026 is 245.95% vs -126.06% in Mar 2025
 Company CV
About Dhruva Capital Services Ltd

Company Coordinates


