Dashboard
Strong ability to service debt as the company has a low Debt to EBITDA ratio of 1.43 times
Poor long term growth as Operating profit has grown by an annual rate 15.27% of over the last 5 years
Positive results in Sep 25
With ROCE of 15.2, it has a Attractive valuation with a 1.8 Enterprise value to Capital Employed
Despite the size of the company, domestic mutual funds hold only 0% of the company
Stock DNA
Pesticides & Agrochemicals
INR 899 Cr (Micro Cap)
17.00
29
0.00%
0.28
12.34%
2.03
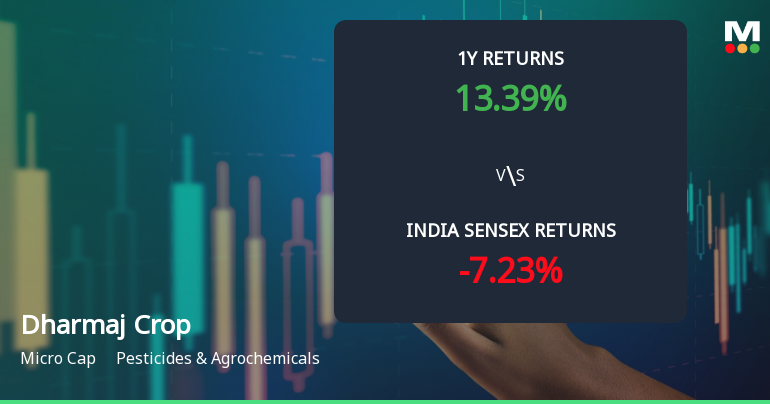
Total Returns (Price + Dividend) 
Dharmaj Crop for the last several years.
Risk Adjusted Returns v/s
Returns Beta

News
Dharmaj Crop Guard Ltd Technical Momentum Shifts Signal Mild Bullish Outlook
Dharmaj Crop Guard Ltd, a micro-cap player in the Pesticides & Agrochemicals sector, has exhibited a subtle but notable shift in its technical momentum, moving from a sideways trend to a mildly bullish stance. This transition is underscored by mixed signals from key technical indicators such as MACD, RSI, Bollinger Bands, and moving averages, suggesting cautious optimism for investors amid a volatile market backdrop.
Read More
Dharmaj Crop Guard Ltd Upgraded to Hold on Improved Technicals and Valuation
Dharmaj Crop Guard Ltd, a micro-cap player in the Pesticides & Agrochemicals sector, has seen its investment rating upgraded from Sell to Hold as of 18 May 2026. This change reflects a nuanced improvement across technical indicators, valuation metrics, financial trends, and overall quality assessments, signalling cautious optimism for investors amid mixed quarterly results.
Read More
Dharmaj Crop Guard Ltd is Rated Sell
Dharmaj Crop Guard Ltd is rated 'Sell' by MarketsMOJO, with this rating last updated on 17 Apr 2026. However, the analysis and financial metrics discussed here reflect the stock's current position as of 12 May 2026, providing investors with the latest insights into the company’s performance and outlook.
Read More Announcements
Announcement under Regulation 30 (LODR)-Earnings Call Transcript
03-Jun-2026 | Source : BSEThe Transcript of the earning call held on May 292026 is attached
Announcement under Regulation 30 (LODR)-Analyst / Investor Meet - Outcome
29-May-2026 | Source : BSEWith reference to our previous intimation for the Q4 & FY26 Earnings Conference call of the Company held on May 292026 at 12.00 PM IST and further in accordance with the requirement of Regulation 30 of the SEBI (Listing Obligations and Disclosure Requirements) Regulations 2015 read with Schedule-III Part-A thereof we hereby inform you that the Audio recordings of Earning Conference call of Q4 & FY26 Financial Results is available as attached
Announcement under Regulation 30 (LODR)-Investor Presentation
28-May-2026 | Source : BSEWith reference to the Captioned Subject the investor presentation is attached for the Fourth Quarter and Year ended March 312026.
Corporate Actions

No Upcoming Board Meetings

No Dividend history available

No Splits history available

No Bonus history available

No Rights history available
Quality key factors
Valuation key factors
Technicals key factors
 Technical Indicator Scale: Bearish, Mildly Bearish, Sideways, Mildly Bullish, Bullish Turned
 Shareholding Snapshot : Mar 2026
Shareholding Compare (%holding)
Promoters
None
Held by 0 Schemes
Held by 6 FIIs (3.13%)
Talavia Rameshbhai Ravajibhai (26.67%)
Unico Global Opportunities Fund Limited (1.48%)
20.29%
Quarterly Results Snapshot (Standalone) - Dec'25 - QoQ

QoQ Growth in quarter ended Dec 2025 is -45.42% vs -5.48% in Sep 2025
QoQ Growth in quarter ended Dec 2025 is -95.56% vs -46.76% in Sep 2025
Half Yearly Results Snapshot (Standalone) - Sep'25
Growth in half year ended Sep 2025 is 26.13% vs 36.66% in Sep 2024

Growth in half year ended Sep 2025 is 38.34% vs -3.81% in Sep 2024
Nine Monthly Results Snapshot (Standalone) - Dec'25
YoY Growth in nine months ended Dec 2025 is 22.00% vs 37.75% in Dec 2024
YoY Growth in nine months ended Dec 2025 is 36.02% vs -17.63% in Dec 2024
Annual Results Snapshot (Standalone) - Mar'25
YoY Growth in year ended Mar 2025 is 45.40% vs 24.76% in Mar 2024
YoY Growth in year ended Mar 2025 is -21.50% vs 65.23% in Mar 2024
About Dharmaj Crop Guard Ltd

Company Coordinates