Dashboard
Weak Long Term Fundamental Strength with a 4.90% CAGR growth in Net Sales over the last 5 years
- Company's ability to service its debt is weak with a poor EBIT to Interest (avg) ratio of 0.07
- The company has been able to generate a Return on Equity (avg) of 0.23% signifying low profitability per unit of shareholders funds
Stock is technically in a Mildly Bearish range
With ROE of 0.9, it has a Expensive valuation with a 0.6 Price to Book Value
Below par performance in long term as well as near term
Stock DNA
Trading & Distributors
INR 8 Cr (Micro Cap)
264.00
48
0.00%
0.00
0.29%
0.58
Total Returns (Price + Dividend) 
Devine Impex for the last several years.
Risk Adjusted Returns v/s
Returns Beta

News

Devine Impex Ltd Falls to 52-Week Low of Rs 7.38 as Sell-Off Deepens
For the fifth consecutive session, Devine Impex Ltd closed lower, slipping to a fresh 52-week low of Rs 7.38 on 15 Apr 2026. This decline comes despite a broader market rally, with the Sensex advancing 1.74% on the same day.
Read More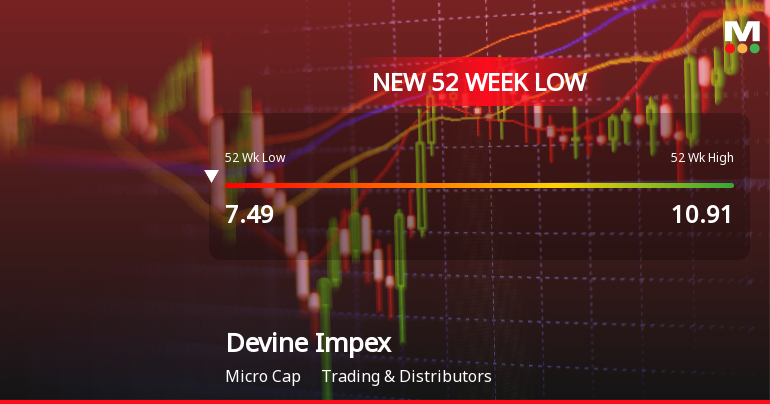
Devine Impex Ltd Falls to 52-Week Low of Rs 7.39 as Sell-Off Deepens
For the fifth consecutive session, Devine Impex Ltd closed lower, slipping to a fresh 52-week low of Rs 7.39 on 6 Apr 2026. This decline comes despite a broader market rally, highlighting stock-specific pressures that have weighed heavily on the micro-cap trading and distribution company.
Read More
Announcements
Announcement under Regulation 30 (LODR)-Newspaper Publication
29-May-2026 | Source : BSESubmission of Newspaper Advertisement
Audited Financial Results For The Quarter And Year Ended 31.03.2026
27-May-2026 | Source : BSESubmission of Audited Financial Results for the quarter and year ended 31.03.2026
Board Meeting Outcome for Audited Financial Results For The Quarter And Year Ended 31.03.2026
27-May-2026 | Source : BSESubmission of outcome of Board meeting
Corporate Actions

No Upcoming Board Meetings

No Dividend history available

No Splits history available

No Bonus history available

No Rights history available
Quality key factors
Valuation key factors
Technicals key factors
 Technical Indicator Scale: Bearish, Mildly Bearish, Sideways, Mildly Bullish, Bullish Turned
 Shareholding Snapshot : Mar 2026
Shareholding Compare (%holding)
Non Institution
None
Held by 1 Schemes (0.02%)
Held by 0 FIIs
Manju Jain (13.11%)
Synergy Cosmetics (exim) Limited (7.76%)
17.73%
Quarterly Results Snapshot (Standalone) - Mar'26 - QoQ

QoQ Growth in quarter ended Mar 2026 is 63.04% vs 24.32% in Dec 2025

QoQ Growth in quarter ended Mar 2026 is -190.00% vs 233.33% in Dec 2025
Half Yearly Results Snapshot (Standalone) - Sep'25
Growth in half year ended Sep 2025 is -31.51% vs 52.08% in Sep 2024
Growth in half year ended Sep 2025 is 0.00% vs 166.67% in Sep 2024
Nine Monthly Results Snapshot (Standalone) - Dec'25
YoY Growth in nine months ended Dec 2025 is -10.28% vs 48.61% in Dec 2024
YoY Growth in nine months ended Dec 2025 is 200.00% vs 100.00% in Dec 2024
Annual Results Snapshot (Standalone) - Mar'26
YoY Growth in year ended Mar 2026 is -15.00% vs 13.64% in Mar 2025
YoY Growth in year ended Mar 2026 is 0.00% vs -25.00% in Mar 2025
About Devine Impex Ltd


