Dashboard
With a Operating Losses, the company has a Weak Long Term Fundamental Strength
- Poor long term growth as Net Sales has grown by an annual rate of 0% and Operating profit at 0% over the last 5 years
- High Debt Company with a Debt to Equity ratio (avg) at 0 times
- PAT(Q) At Rs -4.08 cr has Fallen at -866.2% (vs previous 4Q average)
- NET SALES(Q) Lowest at Rs 93.08 cr
- PBDIT(Q) Lowest at Rs -2.50 cr.
Risky - Negative Operating Profits
Falling Participation by Institutional Investors
Stock DNA
Commodity Chemicals
INR 211 Cr ()
NA (Loss Making)
42
0.00%
0.00
0.00%
1.03
Total Returns (Price + Dividend) 
DCM Shriram Fine for the last several years.
Risk Adjusted Returns v/s
Returns Beta

News
DCM Shriram Fine Chemicals Ltd Downgraded to Strong Sell Amid Weak Fundamentals and Bearish Technicals
DCM Shriram Fine Chemicals Ltd has been downgraded to a Strong Sell rating with a Mojo Score of 9.0, reflecting deteriorating fundamentals, risky valuation metrics, and a shift to a mildly bearish technical trend. The micro-cap commodity chemicals company’s recent performance and financial indicators have raised significant concerns among analysts, prompting a comprehensive reassessment of its investment appeal.
Read More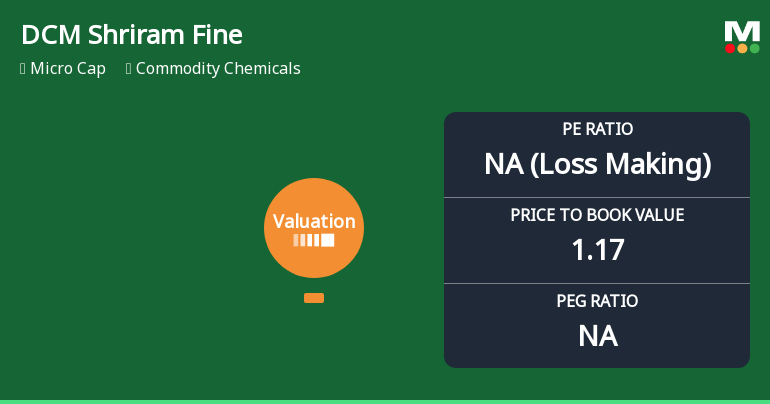
DCM Shriram Fine Chemicals Ltd Faces Valuation Reassessment Amidst Market Pressure
DCM Shriram Fine Chemicals Ltd, a micro-cap player in the commodity chemicals sector, has recently undergone a significant shift in its valuation parameters, prompting a downgrade to a 'Strong Sell' rating with a Mojo Score of 9.0. This change reflects deteriorating price attractiveness as key valuation metrics such as the price-to-earnings (P/E) ratio and price-to-book value (P/BV) have moved into risky territory, contrasting sharply with its industry peers.
Read More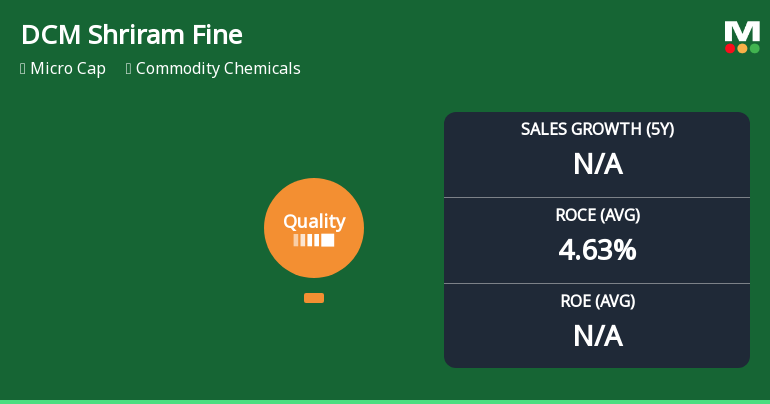
DCM Shriram Fine Chemicals Ltd Faces Downgrade Amidst Deteriorating Business Fundamentals
DCM Shriram Fine Chemicals Ltd, a micro-cap player in the commodity chemicals sector, has recently undergone a significant quality grade downgrade from 'Does Not Qualify' to 'Below Average' as of 20 May 2026. This shift reflects deteriorating business fundamentals, including subdued returns on equity and capital employed, alongside persistent debt concerns. The company’s Mojo Score now stands at 9.0 with a Strong Sell rating, signalling caution for investors amid challenging market conditions and operational inconsistencies.
Read More Announcements
Shareholder Meeting / Postal Ballot-Scrutinizers Report
30-May-2026 | Source : BSEScrutinizers Report dated 30.05.2026 for the Postal Ballot dated 23.04.2026 - DCM Shriram Fine Chemicals Limited
Announcement under Regulation 30 (LODR)-Newspaper Publication
30-May-2026 | Source : BSENewspaper Publication- Pre-intimation regarding 5th Annual General Meeting
Imposition Of Fine By Stock Exchanges
28-May-2026 | Source : BSEImposition of Fine by Stock Exchanges
Corporate Actions

No Upcoming Board Meetings

No Dividend history available

No Splits history available

No Bonus history available

No Rights history available
Quality key factors
Valuation key factors
Technicals key factors
 Technical Indicator Scale: Bearish, Mildly Bearish, Sideways, Mildly Bullish, Bullish Turned
 Shareholding Snapshot : Mar 2026
Shareholding Compare (%holding)
Promoters
None
Held by 2 Schemes (0.0%)
Held by 36 FIIs (1.48%)
Lala Bansi Dhar & Sons (13.83%)
Life Insurance Corporation Of India (4.64%)
25.61%
Quarterly Results Snapshot (Standalone) - Mar'26 - QoQ

QoQ Growth in quarter ended Mar 2026 is -3.68% vs -0.22% in Dec 2025
QoQ Growth in quarter ended Mar 2026 is -151.85% vs 40.44% in Dec 2025
Annual Results Snapshot (Standalone) - Mar'26
Not Applicable: The company has declared_date for only one period
Not Applicable: The company has declared_date for only one period


