Dashboard
Weak Long Term Fundamental Strength with a 11.60% CAGR growth in Operating Profits over the last 5 years
- Low ability to service debt as the company has a high Debt to EBITDA ratio of 4.63 times
- The company has been able to generate a Return on Equity (avg) of 2.23% signifying low profitability per unit of shareholders funds
Flat results in Dec 25
With ROCE of 6, it has a Expensive valuation with a 2.3 Enterprise value to Capital Employed
Stock DNA
Pharmaceuticals & Biotechnology
INR 103 Cr (Micro Cap)
97.00
34
0.00%
0.49
1.69%
2.12
Total Returns (Price + Dividend) 
Concord Drugs for the last several years.
Risk Adjusted Returns v/s
Returns Beta

News
When is the next results date for Concord Drugs Ltd?
The next results date for Concord Drugs Ltd is scheduled for 27 May 2026....
Read More
Concord Drugs Ltd is Rated Sell
Concord Drugs Ltd is rated Sell by MarketsMOJO, with this rating last updated on 23 Feb 2026. However, the analysis and financial metrics discussed here reflect the stock’s current position as of 13 May 2026, providing investors with an up-to-date view of the company’s fundamentals, valuation, financial trends, and technical outlook.
Read More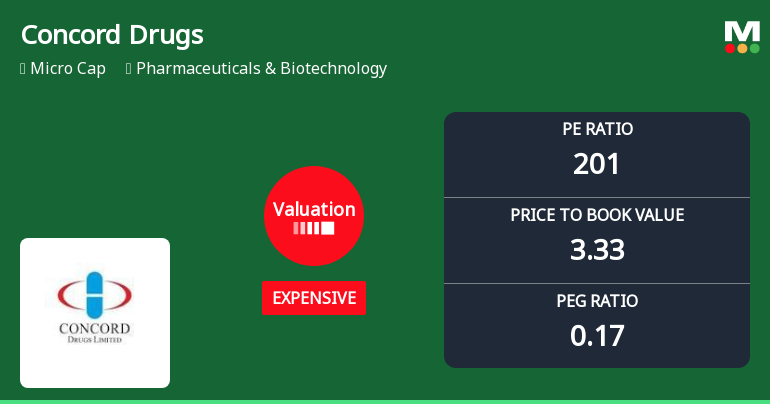
Concord Drugs Ltd Valuation Shifts Signal Elevated Price Risk Amidst Strong Returns
Concord Drugs Ltd has seen a marked shift in its valuation parameters, moving from fair to expensive territory, prompting a downgrade in its investment grade. With a price-to-earnings (P/E) ratio soaring to 200.86 and price-to-book value (P/BV) at 3.33, investors are urged to reassess the stock’s price attractiveness amid sector peers and historical benchmarks.
Read More Announcements
Announcement under Regulation 30 (LODR)-Newspaper Publication
01-Jun-2026 | Source : BSECopy of Newspaper publication for audited results for year ended 31st March2026.
Compliances-Reg.24(A)-Annual Secretarial Compliance
29-May-2026 | Source : BSEAnnual Secretarial Compliance report under Regulation 24(A)
Financial Results For Year Ending 31St March2026
29-May-2026 | Source : BSEFinancial Results for Year ending 31st March 2026
Corporate Actions

No Upcoming Board Meetings

No Dividend history available

No Splits history available

No Bonus history available

No Rights history available
Quality key factors
Valuation key factors
Technicals key factors
 Technical Indicator Scale: Bearish, Mildly Bearish, Sideways, Mildly Bullish, Bullish Turned
 Shareholding Snapshot : Mar 2026
Shareholding Compare (%holding)
Promoters
None
Held by 0 Schemes
Held by 0 FIIs
Nagi Reddy Seelam (28.61%)
Ganga Devi Loya (1.94%)
44.66%
Quarterly Results Snapshot (Consolidated) - Mar'26 - YoY

YoY Growth in quarter ended Mar 2026 is 264.77% vs -33.57% in Mar 2025
YoY Growth in quarter ended Mar 2026 is 1,225.00% vs 111.76% in Mar 2025
Half Yearly Results Snapshot (Consolidated) - Sep'25

Growth in half year ended Sep 2025 is -0.75% vs 45.73% in Sep 2024
Growth in half year ended Sep 2025 is 342.86% vs -93.33% in Sep 2024
Nine Monthly Results Snapshot (Consolidated) - Dec'25
YoY Growth in nine months ended Dec 2025 is 17.24% vs 19.02% in Dec 2024
YoY Growth in nine months ended Dec 2025 is 76.67% vs -62.96% in Dec 2024
Annual Results Snapshot (Consolidated) - Mar'26
YoY Growth in year ended Mar 2026 is 74.08% vs 0.71% in Mar 2025
YoY Growth in year ended Mar 2026 is 211.76% vs -27.66% in Mar 2025
About Concord Drugs Ltd


