Stock DNA
Non - Ferrous Metals
INR 33 Cr (Micro Cap)
10.00
26
0.00%
-0.06
6.45%
0.60
Total Returns (Price + Dividend) 
Chennai Ferrous for the last several years.
Risk Adjusted Returns v/s
Returns Beta

News
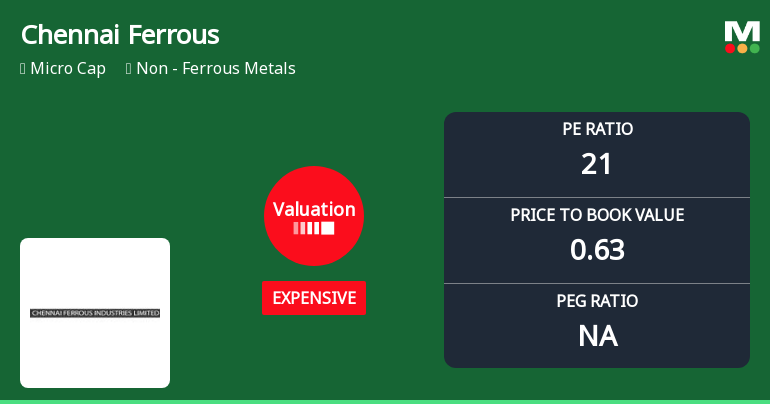
Chennai Ferrous Industries Ltd Valuation Shifts Signal Price Attractiveness Challenges
Chennai Ferrous Industries Ltd, a micro-cap player in the Non-Ferrous Metals sector, has seen its valuation parameters shift notably, moving from fair to expensive territory. Despite a modest day change of 0.26%, the company’s price-to-earnings (P/E) ratio now stands at 21.24, raising questions about price attractiveness relative to historical averages and peer benchmarks. This article analyses the valuation changes, financial metrics, and market performance to provide a comprehensive view for investors.
Read More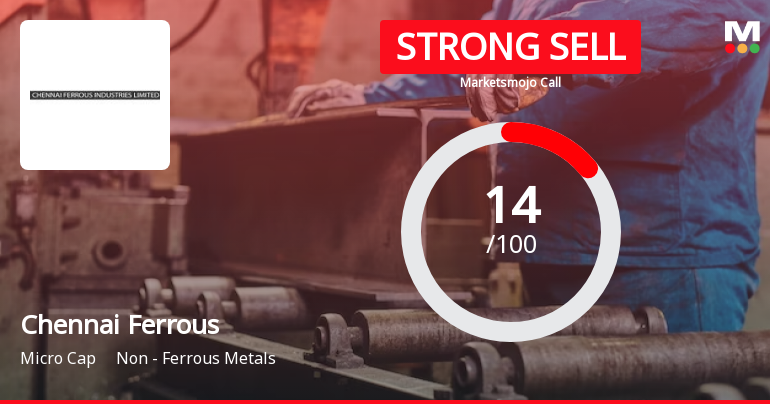
Chennai Ferrous Industries Ltd is Rated Strong Sell
Chennai Ferrous Industries Ltd is rated Strong Sell by MarketsMOJO, with this rating last updated on 13 Nov 2025. However, the analysis and financial metrics discussed here reflect the company’s current position as of 13 May 2026, providing investors with an up-to-date view of its fundamentals, valuation, financial trends, and technical outlook.
Read More
Chennai Ferrous Industries Ltd Valuation Shifts Signal Price Attractiveness Challenges
Chennai Ferrous Industries Ltd has seen a notable shift in its valuation parameters, moving from fair to expensive territory, raising questions about its price attractiveness amid a challenging market backdrop. Despite a strong micro-cap status and a recent downgrade to a Strong Sell rating, the company’s valuation metrics and returns relative to peers and benchmarks warrant close scrutiny for investors seeking clarity on its prospects.
Read More Announcements
Board Meeting Outcome for Approval Of Standalone Audited Financial Results For The Quarter And Financial Year Ended March 31 2026.
29-May-2026 | Source : BSEApproval of Standalone Audited Financial Results for the Quarter and Financial Year ended March 31 2026.
Compliances-Reg.24(A)-Annual Secretarial Compliance
29-May-2026 | Source : BSEAnnual Secretarial Compliance Report for the Financial Year ended March 31 2026.
Results-Financial Results For The Quarter And Financial Year Ended March 31 2026
29-May-2026 | Source : BSEApproval of Standalone Audited Financial Results for the Quarter and Financial Year ended March 31 2026.
Corporate Actions

No Upcoming Board Meetings

No Dividend history available

No Splits history available

No Bonus history available

No Rights history available
Quality key factors
Valuation key factors
Technicals key factors
 Technical Indicator Scale: Bearish, Mildly Bearish, Sideways, Mildly Bullish, Bullish Turned
 Shareholding Snapshot : Mar 2026
Shareholding Compare (%holding)
Promoters
None
Held by 0 Schemes
Held by 0 FIIs
Avantika Gupta (9.1%)
Chennai Material Recycling And Trading Co Pvt Ltd (8.57%)
20.11%
Quarterly Results Snapshot (Standalone) - Mar'26 - YoY

YoY Growth in quarter ended Mar 2026 is -89.79% vs 193.05% in Mar 2025

YoY Growth in quarter ended Mar 2026 is 942.11% vs -82.08% in Mar 2025
Half Yearly Results Snapshot (Standalone) - Sep'25
Growth in half year ended Sep 2025 is -11.18% vs 44.93% in Sep 2024
Growth in half year ended Sep 2025 is -19.56% vs -10.86% in Sep 2024
Nine Monthly Results Snapshot (Standalone) - Dec'25
YoY Growth in nine months ended Dec 2025 is -22.22% vs 38.97% in Dec 2024
YoY Growth in nine months ended Dec 2025 is -62.92% vs 1.32% in Dec 2024
Annual Results Snapshot (Standalone) - Mar'26
YoY Growth in year ended Mar 2026 is -40.52% vs 63.05% in Mar 2025
YoY Growth in year ended Mar 2026 is -15.71% vs 43.73% in Mar 2025
About Chennai Ferrous Industries Ltd


