Dashboard
Weak Long Term Fundamental Strength with an average Return on Equity (ROE) of 2.90%
- Poor long term growth as Net Sales has grown by an annual rate of 10.39% over the last 5 years
- Company's ability to service its debt is weak with a poor EBIT to Interest (avg) ratio of -0.38
Negative results in Mar 26
Stock is technically in a Mildly Bearish range
With ROCE of 1.9, it has a Expensive valuation with a 7.1 Enterprise value to Capital Employed
29.19% of Promoter Shares are Pledged
Stock DNA
Electronics & Appliances
INR 3,619 Cr (Small Cap)
228.00
88
2.80%
0.34
8.46%
6.98
Total Returns (Price + Dividend) 
Latest dividend: 36 per share ex-dividend date: Jul-09-2025
Risk Adjusted Returns v/s
Returns Beta

News
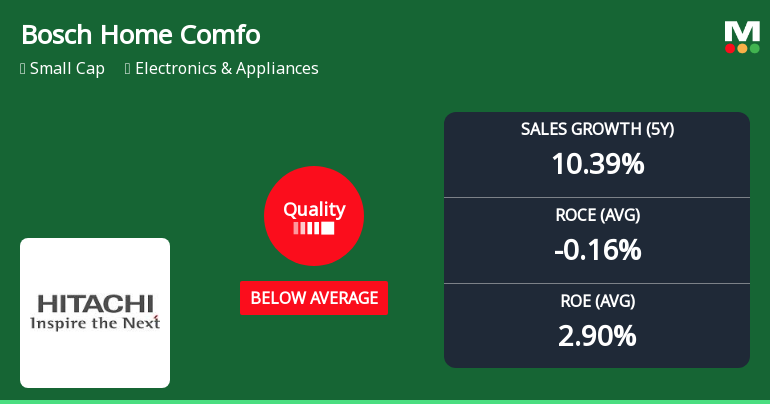
Bosch Home Comfort India Ltd Downgraded as Quality Parameters Deteriorate Amid Weak Financials
Bosch Home Comfort India Ltd has recently undergone a significant downgrade in its quality grading, slipping from an average to a below average rating. This shift reflects deteriorating business fundamentals, including weakening profitability metrics, inconsistent earnings growth, and rising concerns over financial leverage and shareholder risk. The company’s current strong sell mojo grade further underscores the challenges it faces in regaining investor confidence.
Read MoreAre Bosch Home Comfort India Ltd latest results good or bad?
Bosch Home Comfort India Ltd's latest financial results for Q4 FY26 reveal a complex picture of performance. The company reported net sales of ₹965.35 crores, reflecting a year-on-year growth of 3.52%. This growth is modest compared to the previous year's performance, indicating potential challenges in maintaining market share or pricing power. The net profit for the quarter was ₹40.87 crores, which represents a significant decline of 27.11% year-on-year, highlighting a deterioration in profitability despite the seasonal surge in demand for air conditioning products. Operating margins also faced pressure, contracting to 7.02% from 9.83% in the same quarter last year, a drop of 281 basis points. This margin compression can be attributed to rising input costs and increased competition within the air conditioning market. Additionally, the profit after tax (PAT) margin decreased to 4.23%, down from 6.01% year-...
Read More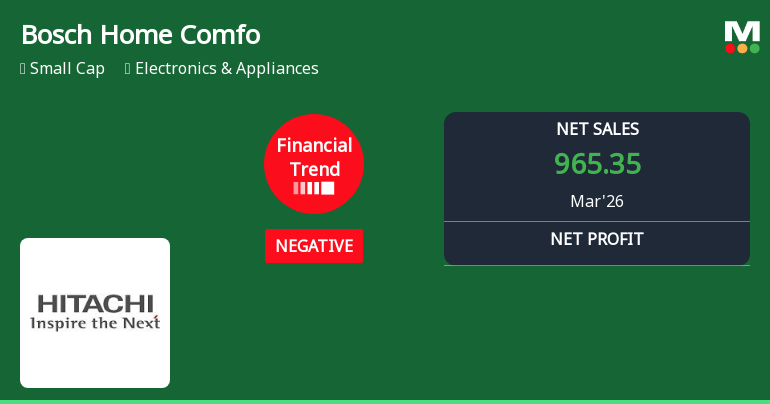
Bosch Home Comfort India Ltd Reports Negative Financial Trend Despite Record Quarterly Sales
Bosch Home Comfort India Ltd posted its highest-ever quarterly net sales of ₹965.35 crores in the quarter ended March 2026, yet profitability metrics showed a marked deterioration, signalling emerging challenges for the small-cap electronics and appliances player amid a shifting financial trend.
Read More Announcements
Shareholder Meeting / Postal Ballot-Notice of Postal Ballot
19-May-2026 | Source : BSEPostal Ballot Notice attached
Announcement under Regulation 30 (LODR)-Change in Directorate
19-May-2026 | Source : BSEForwarding herewith disclosure under Regulation 30 regarding appointment of Mr. Marcel Heese as Director and re-apppointment of Mr. Sanjay Sudhakaran Managing Director of the Company
Financial Results For The Year Ended 31St March 2026 Is Attached.
19-May-2026 | Source : BSEFinancial results for the year ended 31st March 2026 is attached.
Corporate Actions

No Upcoming Board Meetings

Bosch Home Comfort India Ltd has declared 360% dividend, ex-date: 09 Jul 25

No Splits history available

No Bonus history available

Bosch Home Comfort India Ltd has announced 1:5 rights issue, ex-date: 05 Mar 13
Quality key factors
Valuation key factors
Technicals key factors
 Technical Indicator Scale: Bearish, Mildly Bearish, Sideways, Mildly Bullish, Bullish Turned
 Shareholding Snapshot : Mar 2026
Shareholding Compare (%holding)
Promoters
29.1889
Held by 3 Schemes (0.96%)
Held by 24 FIIs (0.67%)
Jchac India Holdco Limited (74.25%)
None
12.51%
Quarterly Results Snapshot (Standalone) - Mar'26 - YoY

YoY Growth in quarter ended Mar 2026 is 3.52% vs 20.83% in Mar 2025
YoY Growth in quarter ended Mar 2026 is -27.11% vs 14.87% in Mar 2025
Half Yearly Results Snapshot (Standalone) - Sep'25
Growth in half year ended Sep 2025 is -9.66% vs 64.31% in Sep 2024
Growth in half year ended Sep 2025 is -505.08% vs 106.26% in Sep 2024
Nine Monthly Results Snapshot (Standalone) - Dec'25
YoY Growth in nine months ended Dec 2025 is -4.96% vs 59.03% in Dec 2024
YoY Growth in nine months ended Dec 2025 is -1,684.78% vs 102.22% in Dec 2024
Annual Results Snapshot (Standalone) - Mar'26
YoY Growth in year ended Mar 2026 is -2.10% vs 43.66% in Mar 2025
YoY Growth in year ended Mar 2026 is -104.50% vs 177.70% in Mar 2025
About Bosch Home Comfort India Ltd


