Dashboard
Stock is technically in a Mildly Bearish range
- The technical trend has deteriorated from Mildly Bearish on 08-May-26 and has generated -1.53% returns since then
- Multiple factors for the stock are Bearish like MACD, Bollinger Band and KST
With ROCE of 29.9, it has a Very Expensive valuation with a 6.1 Enterprise value to Capital Employed
Despite the size of the company, domestic mutual funds hold only 0% of the company
Consistent Underperformance against the benchmark over the last 3 years
Stock DNA
Software Products
INR 1,393 Cr (Micro Cap)
23.00
21
0.00%
0.54
33.12%
1.52
Total Returns (Price + Dividend) 
Latest dividend: 0.02 per share ex-dividend date: Oct-11-2024
Risk Adjusted Returns v/s
Returns Beta

News
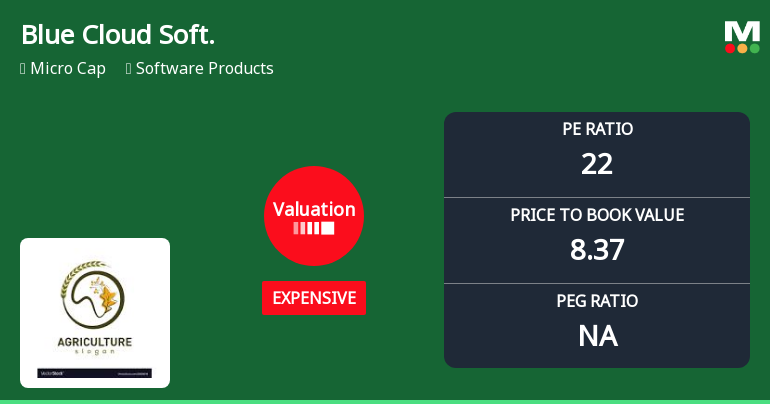
Blue Cloud Softech Solutions Ltd: Valuation Shift Signals Price Attractiveness Change
Blue Cloud Softech Solutions Ltd has seen a notable shift in its valuation parameters, moving from a 'very expensive' to an 'expensive' rating, reflecting a subtle but significant change in price attractiveness. Despite robust profitability metrics, the stock’s elevated price-to-earnings (P/E) and price-to-book value (P/BV) ratios relative to peers and historical averages suggest investors should approach with caution amid recent market volatility.
Read More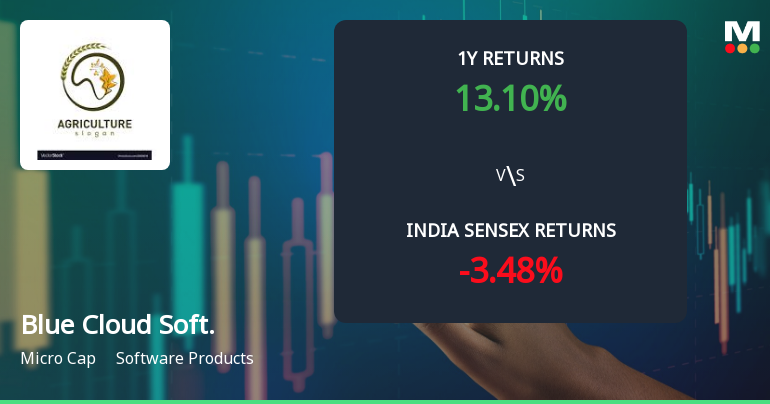
Blue Cloud Softech Solutions Ltd Faces Bearish Momentum Amid Technical Downgrade
Blue Cloud Softech Solutions Ltd, a micro-cap player in the Software Products sector, has experienced a notable shift in its technical momentum, prompting a downgrade in its Mojo Grade from Hold to Sell as of 17 Nov 2025. The stock’s recent price action and technical indicators suggest increasing bearish pressure, raising concerns for investors amid a challenging market backdrop.
Read More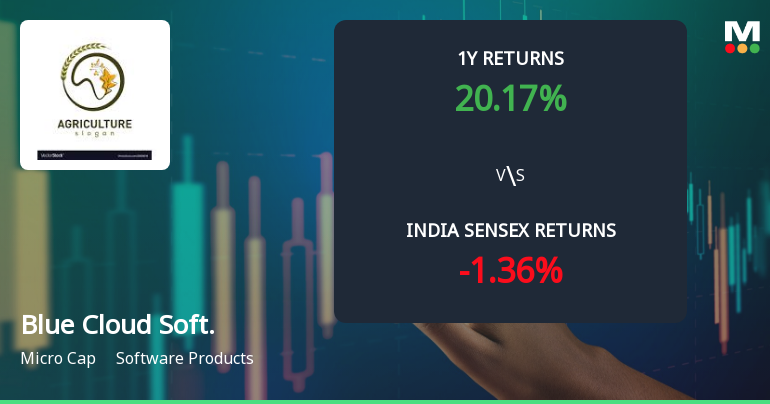
Blue Cloud Softech Solutions Ltd Faces Bearish Momentum Amid Mixed Technical Signals
Blue Cloud Softech Solutions Ltd, a micro-cap player in the Software Products sector, has experienced a notable shift in its technical momentum, moving from mildly bearish to a more pronounced bearish trend. Despite a modest day gain of 1.88%, the company’s technical indicators present a complex picture, with mixed signals from MACD, RSI, moving averages, and other momentum oscillators, prompting a downgrade in its Mojo Grade from Hold to Sell as of 17 Nov 2025.
Read More Announcements
Announcement under Regulation 30 (LODR)-Change in Management
10-Jun-2026 | Source : BSEOutcome of Board Meeting -Appointment and Resignation of Chief Financial Officer of the Company pursuant to Regulation 30 of the Securities Exchange Board of India (Listing Obligations and Disclosure Requirement) Regulations 2015 (Listing Regulations).
Announcement under Regulation 30 (LODR)-Earnings Call Transcript
10-Jun-2026 | Source : BSESubmission of Transcript for the Earnings Conference Call held for Q4 and Year ended 31st March 2026
Announcement under Regulation 30 (LODR)-Analyst / Investor Meet - Outcome
05-Jun-2026 | Source : BSESub: Disclosure of audio recording of the earnings conference call with analysts and investors held on June 5 2026 on the audited financial results for the fourth quarter and year ended March 31 2026 under Regulation 30 read with Regulation 46(2) of the SEBI (LODR) Regulations 2015.
Corporate Actions

No Upcoming Board Meetings

Blue Cloud Softech Solutions Ltd has declared 1% dividend, ex-date: 11 Oct 24

Blue Cloud Softech Solutions Ltd has announced 1:2 stock split, ex-date: 20 Jan 25

No Bonus history available

No Rights history available
Quality key factors
Valuation key factors
Technicals key factors
 Technical Indicator Scale: Bearish, Mildly Bearish, Sideways, Mildly Bullish, Bullish Turned
 Shareholding Snapshot : Mar 2026
Shareholding Compare (%holding)
Non Institution
None
Held by 0 Schemes
Held by 3 FIIs (13.29%)
Yarlagadda Janaki (38.06%)
Siraj Holding Llc (23.33%)
13.16%
Quarterly Results Snapshot (Consolidated) - Mar'26 - QoQ

QoQ Growth in quarter ended Mar 2026 is 4.56% vs 4.94% in Dec 2025
QoQ Growth in quarter ended Mar 2026 is -34.82% vs 20.49% in Dec 2025
Half Yearly Results Snapshot (Consolidated) - Sep'25
Growth in half year ended Sep 2025 is -1.62% vs 284.37% in Sep 2024
Growth in half year ended Sep 2025 is 36.56% vs 536.44% in Sep 2024
Nine Monthly Results Snapshot (Consolidated) - Dec'25
YoY Growth in nine months ended Dec 2025 is 18.13% vs 112.12% in Dec 2024
YoY Growth in nine months ended Dec 2025 is 54.95% vs 316.40% in Dec 2024
Annual Results Snapshot (Consolidated) - Mar'26
YoY Growth in year ended Mar 2026 is 25.73% vs 58.68% in Mar 2025
YoY Growth in year ended Mar 2026 is 36.66% vs 175.31% in Mar 2025
About Blue Cloud Softech Solutions Ltd


