Dashboard
With a Operating Losses, the company has a Weak Long Term Fundamental Strength
- Poor long term growth as Operating profit has grown by an annual rate -12.60% of over the last 5 years
- Company's ability to service its debt is weak with a poor EBIT to Interest (avg) ratio of 0.86
Flat results in Dec 25
Stock is technically in a Bearish range
Risky - Negative EBITDA
Stock DNA
Non Banking Financial Company (NBFC)
INR 35 Cr (Micro Cap)
37.00
23
0.00%
0.00
1.74%
0.35
Total Returns (Price + Dividend) 
Biogen Pharma for the last several years.
Risk Adjusted Returns v/s
Returns Beta

News

Biogen Pharmachem Industries Ltd is Rated Strong Sell
Biogen Pharmachem Industries Ltd is rated Strong Sell by MarketsMOJO. This rating was last updated on 08 Sep 2025, reflecting a significant reassessment of the stock’s outlook. However, the analysis and financial metrics discussed below represent the company’s current position as of 21 May 2026, providing investors with the latest insights into its performance and prospects.
Read More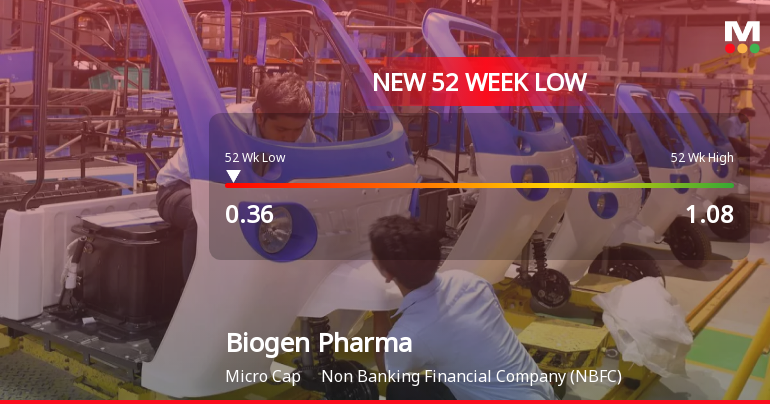
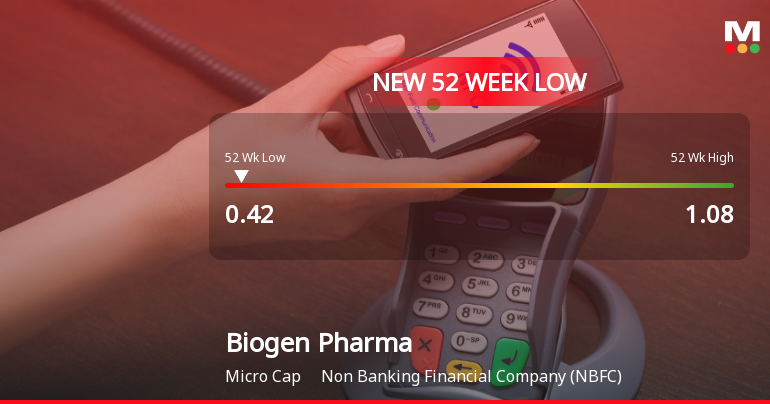
Biogen Pharmachem Industries Ltd Falls to 52-Week Low of Rs 0.42 as Sell-Off Deepens
A sharp decline has pushed Biogen Pharmachem Industries Ltd to a fresh 52-week low of Rs 0.42 on 13 May 2026, marking a significant 61% drop from its peak of Rs 1.08 within the last year. This downturn comes despite some improvement in profitability, highlighting a complex interplay of valuation and market sentiment pressures.
Read More Announcements
Closure of Trading Window
12-Jun-2026 | Source : BSEPFA
Compliances-Reg.24(A)-Annual Secretarial Compliance
23-May-2026 | Source : BSEPFA
Disclosures under Reg. 29(2) of SEBI (SAST) Regulations 2011
20-May-2026 | Source : BSEThe Exchange has received the disclosure under Regulation 29(2) of SEBI (Substantial Acquisition of Shares & Takeovers) Regulations 2011 for Rama Shiva Lease Finance Pvt Ltd
Corporate Actions

No Upcoming Board Meetings

No Dividend history available

No Splits history available

Biogen Pharmachem Industries Ltd has announced 1:6 bonus issue, ex-date: 15 May 26

No Rights history available
Quality key factors
Valuation key factors
Technicals key factors
 Technical Indicator Scale: Bearish, Mildly Bearish, Sideways, Mildly Bullish, Bullish Turned
 Shareholding Snapshot : May 2026
Shareholding Compare (%holding)
Non Institution
None
Held by 0 Schemes
Held by 0 FIIs
None
Omega Coal Private Limited (5.05%)
69.24%
Quarterly Results Snapshot (Standalone) - Dec'25 - YoY
YoY Growth in quarter ended Dec 2025 is 0.00% vs 0.00% in Dec 2024

YoY Growth in quarter ended Dec 2025 is 248.39% vs -616.67% in Dec 2024
Half Yearly Results Snapshot (Standalone) - Sep'25
Growth in half year ended Sep 2025 is 0.00% vs 0.00% in Sep 2024
Growth in half year ended Sep 2025 is 173.28% vs -202.65% in Sep 2024
Nine Monthly Results Snapshot (Standalone) - Dec'25
YoY Growth in nine months ended Dec 2025 is 0.00% vs 0.00% in Dec 2024
YoY Growth in nine months ended Dec 2025 is 189.12% vs -223.53% in Dec 2024
Annual Results Snapshot (Standalone) - Mar'25
YoY Growth in year ended Mar 2025 is 0.00% vs 0.00% in Mar 2024

YoY Growth in year ended Mar 2025 is -115.03% vs 319.57% in Mar 2024
About Biogen Pharmachem Industries Ltd


