Dashboard
Weak Long Term Fundamental Strength with an average Return on Equity (ROE) of 7.62%
- Poor long term growth as Operating profit has grown by an annual rate 10.76% of over the last 5 years
With a growth in Net Profit of 332.61%, the company declared Very Positive results in Dec 25
Stock is technically in a Bullish range
With ROE of 12.2, it has a Expensive valuation with a 1.9 Price to Book Value
Majority shareholders : Promoters
Consistent Returns over the last 3 years
Stock DNA
Garments & Apparels
INR 71 Cr (Micro Cap)
13.00
24
0.00%
-0.29
3.70%
2.11
Total Returns (Price + Dividend) 
Betex India for the last several years.
Risk Adjusted Returns v/s
Returns Beta

News
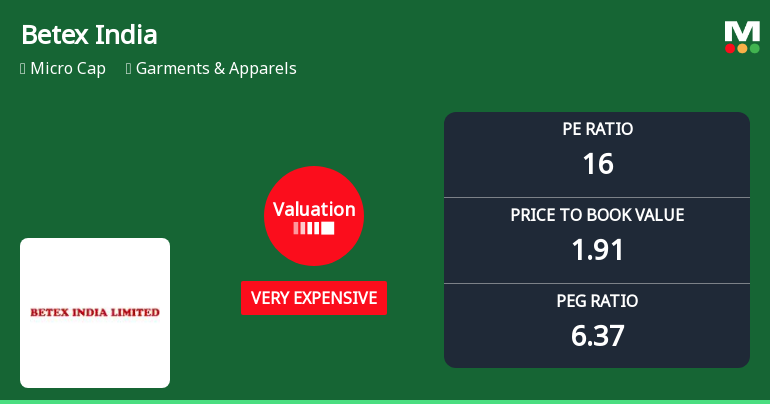
Betex India Ltd Valuation Shifts Signal Price Attractiveness Challenges
Betex India Ltd, a micro-cap player in the Garments & Apparels sector, has witnessed a notable shift in its valuation parameters, moving from fair to very expensive territory. Despite this, the stock has delivered exceptional returns over multiple time horizons, outperforming the Sensex by a wide margin. This article analyses the recent valuation changes, compares Betex’s metrics with peers, and assesses the implications for investors.
Read More
Betex India Ltd is Rated Sell
Betex India Ltd is rated 'Sell' by MarketsMOJO, with this rating last updated on 13 Feb 2026. However, the analysis and financial metrics discussed here reflect the stock's current position as of 05 May 2026, providing investors with an up-to-date view of the company’s fundamentals, returns, and market performance.
Read More
Betex India Ltd is Rated Sell by MarketsMOJO
Betex India Ltd is rated 'Sell' by MarketsMOJO, with this rating last updated on 13 February 2026. However, all fundamentals, returns, and financial metrics discussed here reflect the stock's current position as of 23 April 2026, providing investors with an up-to-date analysis of the company's standing.
Read More Announcements
Announcement under Regulation 30 (LODR)-Newspaper Publication
02-Jun-2026 | Source : BSENewspaper Publication of Financial Results for Year ended on 31.03.2026
Board Meeting Outcome for Outcome Of Board Meeting For Approval Of Audited Financial Results For Year Ended On 31.03.2026
30-May-2026 | Source : BSEOutcome of Board meeting for approval of Audited Financial Results for year ended on 31.03.2026
Integrated Financial Results
30-May-2026 | Source : BSEIntegrated Financial Results for the quarter and Year ended on 31.03.2026
Corporate Actions

No Upcoming Board Meetings

No Dividend history available

No Splits history available

No Bonus history available

No Rights history available
Quality key factors
Valuation key factors
Technicals key factors
 Technical Indicator Scale: Bearish, Mildly Bearish, Sideways, Mildly Bullish, Bullish Turned
 Shareholding Snapshot : Mar 2026
Shareholding Compare (%holding)
Promoters
None
Held by 0 Schemes
Held by 0 FIIs
Sumeetsilk Processors Private Limited (35.82%)
Shaktiveer Texfab Private Limited (10.66%)
32.53%
Quarterly Results Snapshot (Standalone) - Mar'26 - QoQ

QoQ Growth in quarter ended Mar 2026 is 8.06% vs -8.57% in Dec 2025

QoQ Growth in quarter ended Mar 2026 is -80.90% vs 332.61% in Dec 2025
Half Yearly Results Snapshot (Standalone) - Sep'25
Growth in half year ended Sep 2025 is -5.70% vs 16.52% in Sep 2024
Growth in half year ended Sep 2025 is -42.59% vs 121.92% in Sep 2024
Nine Monthly Results Snapshot (Standalone) - Dec'25
YoY Growth in nine months ended Dec 2025 is -0.77% vs 8.86% in Dec 2024
YoY Growth in nine months ended Dec 2025 is 81.85% vs 37.06% in Dec 2024
Annual Results Snapshot (Standalone) - Mar'26
YoY Growth in year ended Mar 2026 is 4.11% vs 7.81% in Mar 2025
YoY Growth in year ended Mar 2026 is 190.77% vs -41.44% in Mar 2025
About Betex India Ltd


