Dashboard
Weak Long Term Fundamental Strength with an average Return on Capital Employed (ROCE) of 8.18%
- Poor long term growth as Net Sales has grown by an annual rate of 8.84% and Operating profit at -14.50% over the last 5 years
- Company's ability to service its debt is weak with a poor EBIT to Interest (avg) ratio of 1.70
Negative results in Dec 25
Stock is technically in a Mildly Bearish range
Stock DNA
Cement & Cement Products
INR 94 Cr (Micro Cap)
318.00
33
0.00%
0.28
2.92%
0.74
Total Returns (Price + Dividend) 
Latest dividend: 1 per share ex-dividend date: Jul-29-2010
Risk Adjusted Returns v/s
Returns Beta

News

Barak Valley Cements Ltd Valuation Shifts to Very Attractive Amidst Mixed Market Performance
Barak Valley Cements Ltd has witnessed a significant shift in its valuation parameters, moving from an attractive to a very attractive rating despite ongoing market headwinds. The micro-cap cement producer’s price-to-book value and enterprise value multiples suggest a compelling entry point, even as its price-to-earnings ratio remains extraordinarily elevated. This article analyses the valuation changes in the context of peer comparisons, historical trends, and recent market performance to provide a comprehensive view for investors.
Read More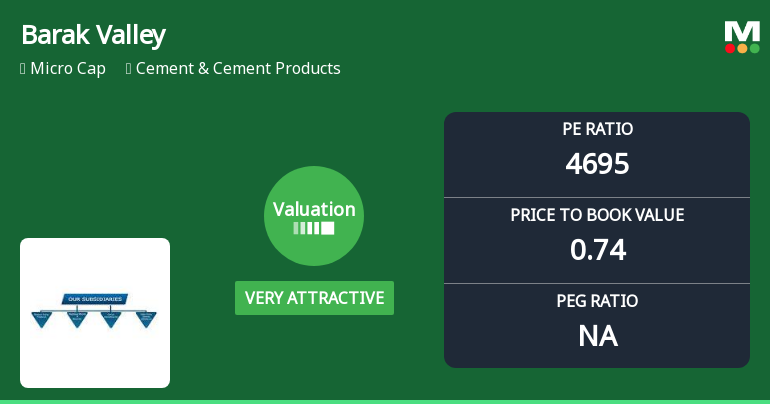
Barak Valley Cements Ltd Valuation Shifts to Very Attractive Amid Market Volatility
Barak Valley Cements Ltd has seen a significant shift in its valuation parameters, moving from an attractive to a very attractive rating despite a sharp decline in its share price. This change comes amid a challenging market environment for the cement sector, with the company’s price-to-earnings (P/E) ratio and price-to-book value (P/BV) metrics diverging markedly from peers and historical averages, prompting a reassessment of its price attractiveness and investment potential.
Read More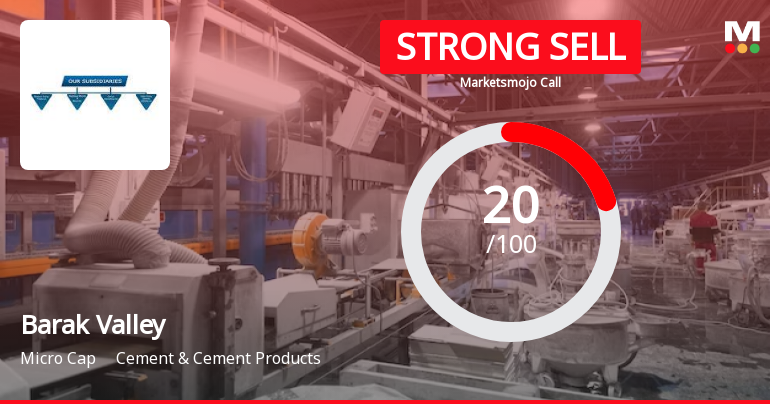
Barak Valley Cements Ltd is Rated Strong Sell
Barak Valley Cements Ltd is rated Strong Sell by MarketsMOJO, with this rating last updated on 24 Feb 2026. However, the analysis and financial metrics discussed here reflect the company’s current position as of 11 May 2026, providing investors with the latest insights into its performance and outlook.
Read More Announcements
Intimation Pursuant To Regulation 30 Of The SEBI (Listing Obligations And Disclosure Requirements) Regulations 2015 -Signing Of Memorandum Of Understanding (Mou) With M/S LKC Industries And Infra Private Limited
30-May-2026 | Source : BSEas enclosed
Announcement under Regulation 30 (LODR)-Newspaper Publication
28-May-2026 | Source : BSEPFa the newspaper publication on published results for the quarter and year ended 31st MArch 2026
Submission Of Financial Results For The Quarter And Year Ended 31St March 2026
27-May-2026 | Source : BSEpfa the results as enclosed
Corporate Actions

No Upcoming Board Meetings

Barak Valley Cements Ltd has declared 10% dividend, ex-date: 29 Jul 10

No Splits history available

No Bonus history available

No Rights history available
Quality key factors
Valuation key factors
Technicals key factors
 Technical Indicator Scale: Bearish, Mildly Bearish, Sideways, Mildly Bullish, Bullish Turned
 Shareholding Snapshot : Mar 2026
Shareholding Compare (%holding)
Promoters
None
Held by 0 Schemes
Held by 0 FIIs
Bina Garodia (9.75%)
Padmawati Credit Capital Pvt Ltd (2.7%)
35.91%
Quarterly Results Snapshot (Consolidated) - Mar'26 - QoQ

QoQ Growth in quarter ended Mar 2026 is 25.18% vs 0.63% in Dec 2025
QoQ Growth in quarter ended Mar 2026 is 162.77% vs -1,183.33% in Dec 2025
Half Yearly Results Snapshot (Consolidated) - Sep'25
Growth in half year ended Sep 2025 is 10.10% vs -10.42% in Sep 2024
Growth in half year ended Sep 2025 is -56.27% vs -56.31% in Sep 2024
Nine Monthly Results Snapshot (Consolidated) - Dec'25
YoY Growth in nine months ended Dec 2025 is 1.70% vs -9.34% in Dec 2024

YoY Growth in nine months ended Dec 2025 is -129.07% vs -52.61% in Dec 2024
Annual Results Snapshot (Consolidated) - Mar'26
YoY Growth in year ended Mar 2026 is 2.04% vs -11.14% in Mar 2025
YoY Growth in year ended Mar 2026 is -94.39% vs -28.69% in Mar 2025
About Barak Valley Cements Ltd


