Dashboard
Weak Long Term Fundamental Strength with a 0% CAGR growth in Operating Profits over the last 5 years
- Company's ability to service its debt is weak with a poor EBIT to Interest (avg) ratio of -0.26
- The company has reported losses. Due to this company has reported negative ROCE
Stock is technically in a Mildly Bearish range
Risky - Negative EBITDA
Underperformed the market in the last 1 year
Stock DNA
Iron & Steel Products
INR 540 Cr (Micro Cap)
234.00
90
0.00%
-0.42
0.21%
4.26
Total Returns (Price + Dividend) 
Azad India for the last several years.
Risk Adjusted Returns v/s
Returns Beta

News
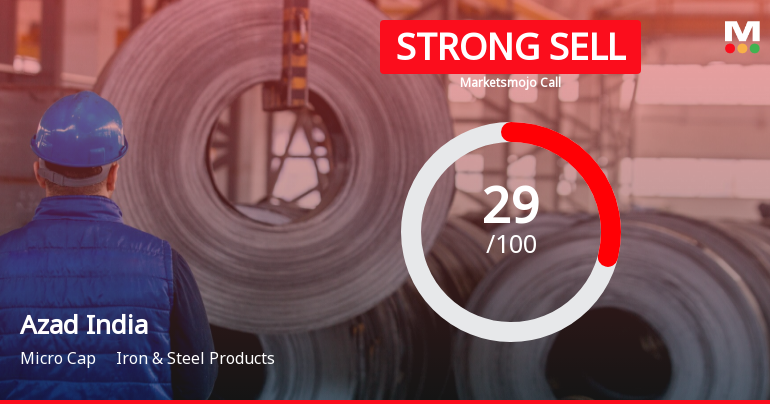
Azad India Mobility Ltd is Rated Strong Sell
Azad India Mobility Ltd is rated Strong Sell by MarketsMOJO. This rating was last updated on 08 Dec 2025, reflecting a shift from the previous 'Sell' grade. However, the analysis below is based on the stock's current fundamentals, returns, and financial metrics as of 06 May 2026, providing investors with an up-to-date perspective on the company’s standing.
Read More
Azad India Mobility Ltd is Rated Strong Sell
Azad India Mobility Ltd is rated Strong Sell by MarketsMOJO. This rating was last updated on 08 Dec 2025, reflecting a reassessment of the stock’s outlook. However, all fundamentals, returns, and financial metrics discussed here are current as of 25 April 2026, providing investors with the latest view on the company’s position.
Read More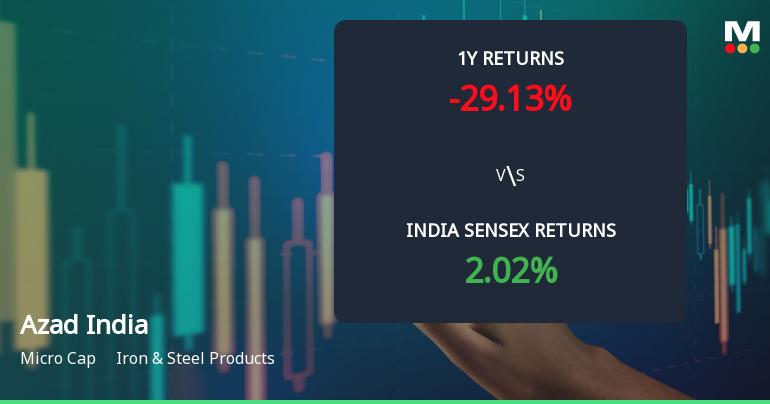
Azad India Mobility Ltd Technical Momentum Shifts Amid Mixed Market Signals
Azad India Mobility Ltd, a micro-cap player in the Iron & Steel Products sector, has experienced a nuanced shift in its technical momentum, moving from a bearish to a mildly bearish stance. Despite a modest day gain of 1.63%, the stock’s technical indicators present a complex picture, with mixed signals from MACD, RSI, moving averages, and other trend analyses, reflecting both short-term resilience and longer-term caution for investors.
Read More Announcements
Board Meeting Outcome for Board Meeting Held On Friday May 29 2026 .
29-May-2026 | Source : BSEApproval of Audited Standalone and Consolidated Financials for the quarter and year ended 31st March2026.
Audited Standalone And Consolidated Financial Results For The Quarter And Year Ended 31St March 2026
29-May-2026 | Source : BSEAudited Standalone & Consolidated Financial Results for the quarter and year ended 31st March 2026
Announcement under Regulation 30 (LODR)-Resignation of Director
29-May-2026 | Source : BSEResignation of Mr. Ramesh Chandra Pareek from the post of the Independent Director of the Company.
Corporate Actions

No Upcoming Board Meetings

No Dividend history available

No Splits history available

No Bonus history available

No Rights history available
Quality key factors
Valuation key factors
Technicals key factors
 Technical Indicator Scale: Bearish, Mildly Bearish, Sideways, Mildly Bullish, Bullish Turned
 Shareholding Snapshot : Mar 2026
Shareholding Compare (%holding)
FIIs
None
Held by 0 Schemes
Held by 9 FIIs (48.7%)
Bupinder Singh Chadha (9.32%)
3 Sigma Global Fund (13.78%)
22.91%
Quarterly Results Snapshot (Consolidated) - Mar'26 - YoY

YoY Growth in quarter ended Mar 2026 is -2.99% vs 0.00% in Mar 2025
YoY Growth in quarter ended Mar 2026 is 683.33% vs 1,000.00% in Mar 2025
Half Yearly Results Snapshot (Standalone) - Sep'25
Growth in half year ended Sep 2025 is 0.00% vs 0.00% in Sep 2024

Growth in half year ended Sep 2025 is 850.00% vs 55.56% in Sep 2024
Nine Monthly Results Snapshot (Standalone) - Dec'25
YoY Growth in nine months ended Dec 2025 is 0.00% vs 0.00% in Dec 2024
YoY Growth in nine months ended Dec 2025 is 451.85% vs -58.82% in Dec 2024
Annual Results Snapshot (Consolidated) - Mar'26
YoY Growth in year ended Mar 2026 is 619.16% vs 0.00% in Mar 2025
YoY Growth in year ended Mar 2026 is 7,800.00% vs 102.48% in Mar 2025
About Azad India Mobility Ltd


