Dashboard
Company has a low Debt to Equity ratio (avg) at 0.04 times
Poor long term growth as Net Sales has grown by an annual rate of 7.12% and Operating profit at 5.48% over the last 5 years
Flat results in Dec 25
Stock is technically in a Mildly Bullish range
With ROE of 11.7, it has a Attractive valuation with a 2 Price to Book Value
Despite the size of the company, domestic mutual funds hold only 0% of the company
Stock DNA
Other Agricultural Products
INR 1,124 Cr (Micro Cap)
17.00
21
1.04%
-0.11
11.73%
1.97
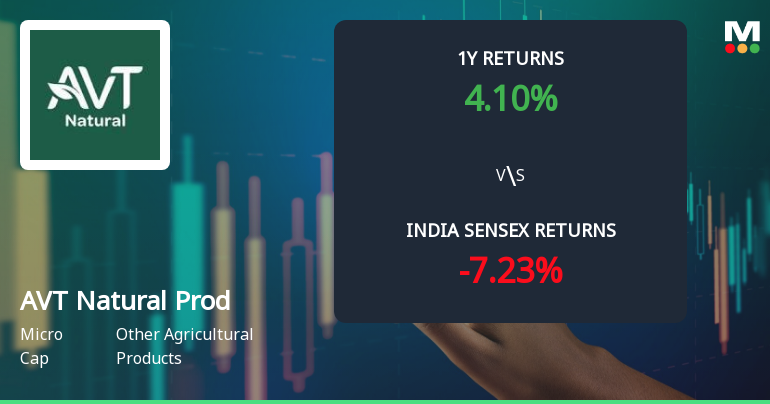
Total Returns (Price + Dividend) 
Latest dividend: 0.3499999999999999 per share ex-dividend date: Feb-18-2026
Risk Adjusted Returns v/s
Returns Beta

News
AVT Natural Products Ltd Technical Momentum Shifts Amid Mixed Market Signals
AVT Natural Products Ltd, a micro-cap player in the Other Agricultural Products sector, has experienced a subtle shift in its technical momentum, moving from a sideways trend to a mildly bearish stance. Despite some bullish indicators on weekly and monthly charts, the stock’s daily moving averages and recent price action suggest caution for investors as the company’s Mojo Grade was downgraded from Hold to Sell on 1 February 2026.
Read More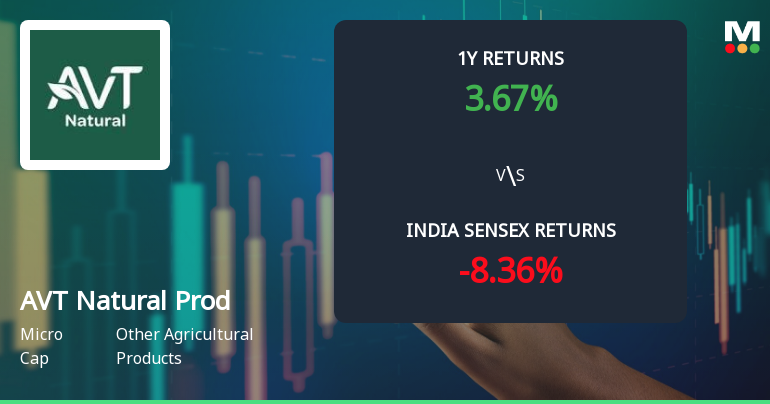
AVT Natural Products Ltd Technical Momentum Shifts Amid Mixed Market Signals
AVT Natural Products Ltd, a micro-cap player in the Other Agricultural Products sector, has experienced a notable shift in its technical momentum, moving from a mildly bearish stance to a sideways trend. Despite a recent day gain of 3.76%, the stock’s technical indicators present a nuanced picture, with some signals suggesting mild bullishness while others remain neutral or mildly bearish. This article analyses the latest technical parameters, price momentum, and relative performance against the Sensex to provide a comprehensive view for investors.
Read More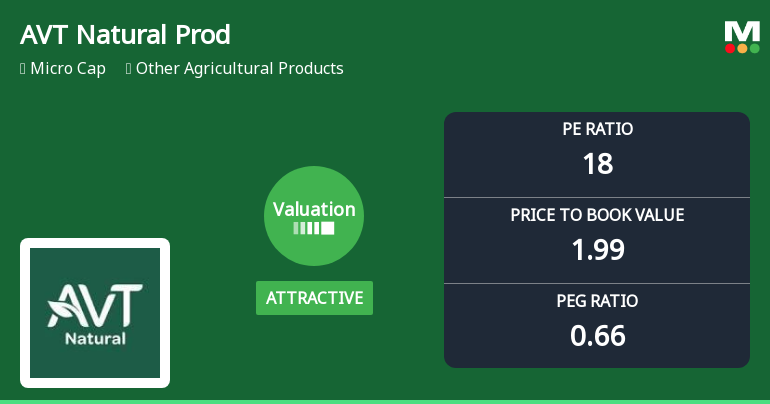
AVT Natural Products Ltd Valuation Shifts Signal Renewed Price Attractiveness
AVT Natural Products Ltd, a micro-cap player in the Other Agricultural Products sector, has seen a notable shift in its valuation parameters, moving from fair to attractive territory. Despite a recent downgrade in its Mojo Grade from Hold to Sell, the company’s price-to-earnings (P/E) and price-to-book value (P/BV) ratios now present a compelling case for value-oriented investors, especially when compared with its peers and historical benchmarks.
Read More Announcements
Record Date For Final Dividend - August 10 2026
09-Jun-2026 | Source : BSERecord Date for Final Dividend
Announcement under Regulation 30 (LODR)-Change in Directorate
09-Jun-2026 | Source : BSEChange in Directorate
Board Meeting Outcome for Outcome Of Board Meeting
09-Jun-2026 | Source : BSEOutcome of Board Meeting
Corporate Actions

No Upcoming Board Meetings

AVT Natural Products Ltd has declared 35% dividend, ex-date: 18 Feb 26

AVT Natural Products Ltd has announced 1:10 stock split, ex-date: 07 Jun 12

AVT Natural Products Ltd has announced 1:1 bonus issue, ex-date: 26 Sep 13

No Rights history available
Quality key factors
Valuation key factors
Technicals key factors
 Technical Indicator Scale: Bearish, Mildly Bearish, Sideways, Mildly Bullish, Bullish Turned
 Shareholding Snapshot : Mar 2026
Shareholding Compare (%holding)
Promoters
None
Held by 0 Schemes
Held by 4 FIIs (0.03%)
Neelamalai Agro Industries Ltd (40.0%)
Vistra Itcl India Limited (1.01%)
19.06%
Quarterly Results Snapshot (Consolidated) - Mar'26 - YoY

YoY Growth in quarter ended Mar 2026 is 44.43% vs 25.44% in Mar 2025
YoY Growth in quarter ended Mar 2026 is 53.34% vs 31.02% in Mar 2025
Half Yearly Results Snapshot (Consolidated) - Sep'25
Growth in half year ended Sep 2025 is 29.33% vs -4.91% in Sep 2024
Growth in half year ended Sep 2025 is 107.09% vs -38.40% in Sep 2024
Nine Monthly Results Snapshot (Consolidated) - Dec'25
YoY Growth in nine months ended Dec 2025 is 21.92% vs 1.78% in Dec 2024
YoY Growth in nine months ended Dec 2025 is 26.31% vs -19.99% in Dec 2024
Annual Results Snapshot (Consolidated) - Mar'26
YoY Growth in year ended Mar 2026 is 28.27% vs 7.50% in Mar 2025
YoY Growth in year ended Mar 2026 is 34.38% vs -9.50% in Mar 2025
About AVT Natural Products Ltd


