Dashboard
Company has a low Debt to Equity ratio (avg) at 0.07 times
With a growth in Net Profit of 69.48%, the company declared Very Positive results in Mar 26
Stock is technically in a Bullish range
High Institutional Holdings at 32.6%
Market Beating performance in long term as well as near term
Stock DNA
Other Electrical Equipment
INR 11,746 Cr (Small Cap)
103.00
58
0.00%
0.15
13.45%
16.14
Total Returns (Price + Dividend) 
Avalon Tech for the last several years.
Risk Adjusted Returns v/s
Returns Beta

News
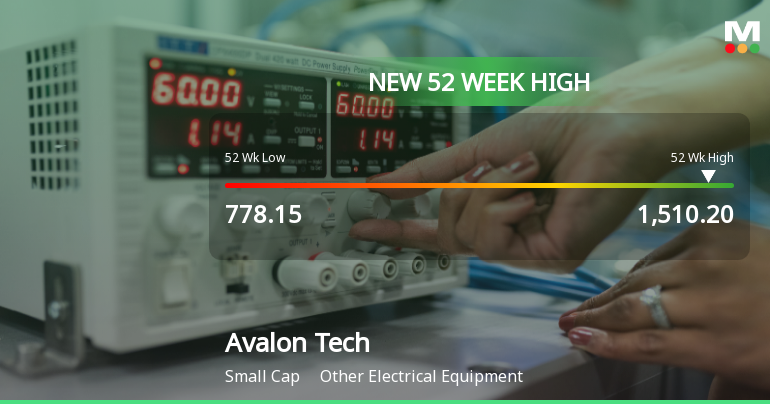
Broad-Based Technical Strength Lifts Avalon Technologies Ltd to 52-Week High of Rs 1510.2
Surging to an all-time high of Rs 1510.2 on 21 May 2026, Avalon Technologies Ltd has demonstrated remarkable price momentum, rallying 68.7% over the past year against a declining Sensex. This milestone caps a five-day winning streak that has propelled the stock well above all key moving averages, signalling robust technical health.
Read More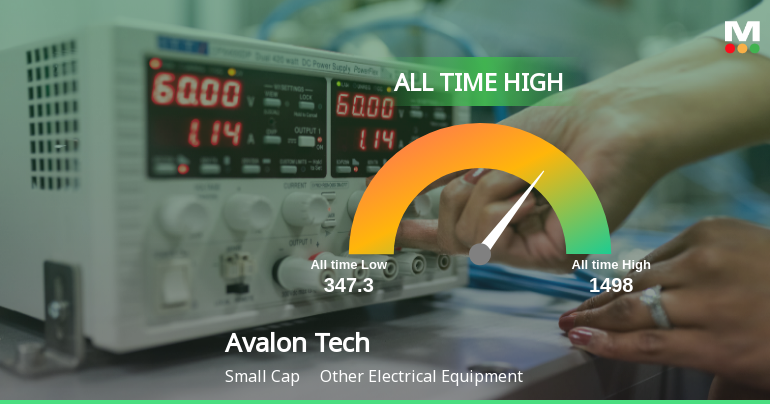
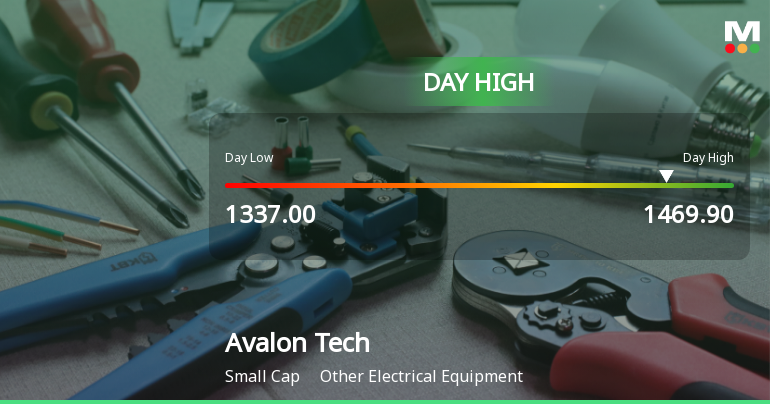
Avalon Technologies Ltd Surges 7.68% to Day's High of Rs 1465 — Outperforms Sector by 8.49 Percentage Points
The Sensex declined by 0.14% on 20 May 2026, while Avalon Technologies Ltd surged 7.68%, marking a remarkable 8.49 percentage-point outperformance over its sector. This strong single-session gain rewrites the short-term narrative for the stock, which has been on a steady upward trajectory over the past week.
Read More Announcements
Announcement under Regulation 30 (LODR)-Analyst / Investor Meet - Intimation
27-May-2026 | Source : BSEPlease find the enclosed Intimation of Investor Meet pursuant to Regulation 30 of SEBI (Listing Obligations and Disclosure Requirements) Regulations 2015.
Announcement under Regulation 30 (LODR)-Analyst / Investor Meet - Intimation
22-May-2026 | Source : BSEPlease find the enclosed Intimation of Investor Meet pursuant to Regulation 30 of SEBI (Listing Obligations and Disclosure Requirements) Regulations 2015.
Compliances-Reg.24(A)-Annual Secretarial Compliance
22-May-2026 | Source : BSEPlease find the enclosed Annual Secretarial Compliance Report for the Financial Year ended March 31 2026 pursuant to Regulation 24A (2) of the SEBI (Listing Obligations and Disclosure Requirements) Regulations 2015.
Corporate Actions

No Upcoming Board Meetings

No Dividend history available

No Splits history available

No Bonus history available

No Rights history available
Quality key factors
Valuation key factors
Technicals key factors
 Technical Indicator Scale: Bearish, Mildly Bearish, Sideways, Mildly Bullish, Bullish Turned
 Shareholding Snapshot : Mar 2026
Shareholding Compare (%holding)
Promoters
None
Held by 16 Schemes (22.34%)
Held by 66 FIIs (6.42%)
Kunhamed Bicha (21.61%)
Nippon Life India Trustee Ltd-a/c Nippon India Small Cap Fund (5.81%)
10.11%
Quarterly Results Snapshot (Consolidated) - Mar'26 - QoQ

QoQ Growth in quarter ended Mar 2026 is 14.93% vs 9.17% in Dec 2025

QoQ Growth in quarter ended Mar 2026 is 26.23% vs 30.50% in Dec 2025
Half Yearly Results Snapshot (Consolidated) - Sep'25
Growth in half year ended Sep 2025 is 48.74% vs 8.81% in Sep 2024
Growth in half year ended Sep 2025 is 158.34% vs 5.71% in Sep 2024
Nine Monthly Results Snapshot (Consolidated) - Dec'25
YoY Growth in nine months ended Dec 2025 is 48.72% vs 16.14% in Dec 2024
YoY Growth in nine months ended Dec 2025 is 83.32% vs 87.19% in Dec 2024
Annual Results Snapshot (Consolidated) - Mar'26
YoY Growth in year ended Mar 2026 is 45.99% vs 26.63% in Mar 2025
YoY Growth in year ended Mar 2026 is 78.04% vs 126.65% in Mar 2025
About Avalon Technologies Ltd

Company Coordinates