Dashboard
With a growth in Net Profit of 138.02%, the company declared Very Positive results in Mar 26
- The company has declared positive results for the last 2 consecutive quarters
- OPERATING PROFIT TO INTEREST(Q) Highest at 9.37 times
- NET SALES(Q) Highest at Rs 747.62 cr
- PBDIT(Q) Highest at Rs 149.56 cr.
Majority shareholders : Promoters
Stock DNA
Heavy Electrical Equipment
INR 14,610 Cr ()
76.00
60
0.00%
0.00
0.00%
19.56
Total Returns (Price + Dividend) 
Atlanta Electric for the last several years.
Risk Adjusted Returns v/s
Returns Beta

News

Atlanta Electricals Ltd Locks at Upper Circuit With 5% Gain — Buyers Queue, Sellers Absent
At Rs 1,662, the buying was done — not because demand dried up, but because the exchange wouldn't let the stock go any higher. Atlanta Electricals Ltd locked at its upper circuit of 5% on 20 May 2026, with buyers queuing and no sellers willing to part with shares.
Read More
Atlanta Electricals Ltd Upgraded to Buy on Strong Fundamentals and Technical Signals
Atlanta Electricals Ltd has been upgraded from a Hold to a Buy rating, reflecting significant improvements across quality, valuation, financial trends, and technical indicators. This upgrade, effective from 18 May 2026, underscores the company’s robust quarterly performance, favourable market positioning, and evolving technical outlook amid a challenging sector environment.
Read More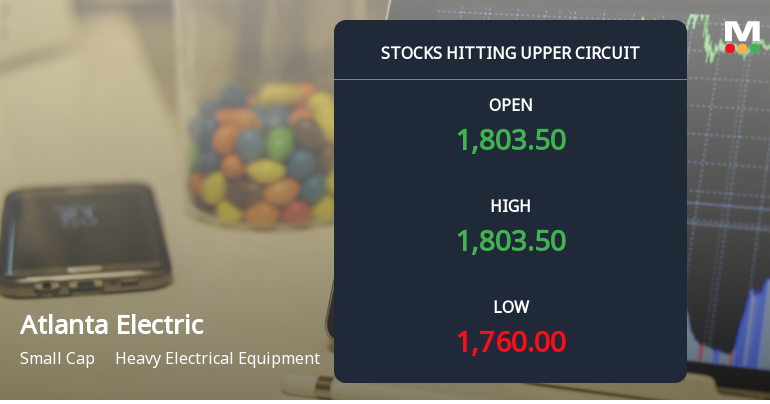
Atlanta Electricals Ltd Locks at Upper Circuit With 5% Gain — Buyers Queue, Sellers Absent
At Rs 1814.8, the buying was done — not because demand dried up, but because the exchange wouldn't let the stock go any higher. Atlanta Electricals Ltd locked at its upper circuit of 5% on 12 May 2026, with buyers queuing and no sellers willing to part with shares.
Read More Announcements
Announcement under Regulation 30 (LODR)-Award_of_Order_Receipt_of_Order
03-Jun-2026 | Source : BSEIntimation of receipt of order aggregating to Rs. 285.15 Crore
Announcement under Regulation 30 (LODR)-Press Release / Media Release
03-Jun-2026 | Source : BSEMedia Release on receipt of order
Announcement under Regulation 30 (LODR)-Analyst / Investor Meet - Intimation
26-May-2026 | Source : BSEIntimation about Plant Visit of Investor Group.
Corporate Actions

No Upcoming Board Meetings

No Dividend history available

No Splits history available

No Bonus history available

No Rights history available
Quality key factors
Valuation key factors
Technicals key factors
 Technical Indicator Scale: Bearish, Mildly Bearish, Sideways, Mildly Bullish, Bullish Turned
 Shareholding Snapshot : Mar 2026
Shareholding Compare (%holding)
Promoters
None
Held by 11 Schemes (3.55%)
Held by 21 FIIs (2.4%)
Narharibhai S. Patel Family Trust (43.63%)
Hdfc Mutual Fund - Hdfc Manufacturing Fund (1.4%)
4.86%
Quarterly Results Snapshot (Standalone) - Mar'26 - QoQ

QoQ Growth in quarter ended Mar 2026 is 58.41% vs 48.86% in Dec 2025
QoQ Growth in quarter ended Mar 2026 is 115.10% vs 63.64% in Dec 2025
Annual Results Snapshot (Standalone) - Mar'26
YoY Growth in year ended Mar 2026 is 48.80% vs 43.41% in Mar 2025

YoY Growth in year ended Mar 2026 is 82.93% vs 86.81% in Mar 2025


