Stock DNA
Non Banking Financial Company (NBFC)
INR 91 Cr (Micro Cap)
46.00
20
0.00%
0.03
2.32%
1.40
Total Returns (Price + Dividend) 
Assam Entrade for the last several years.
Risk Adjusted Returns v/s
Returns Beta

News
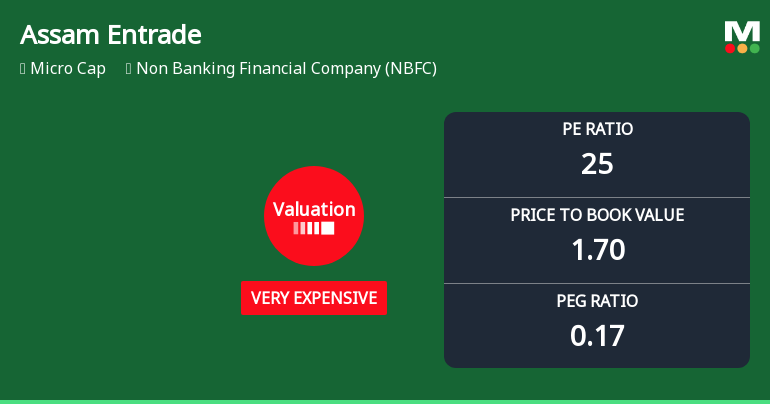
Assam Entrade Ltd Valuation Shifts Signal Elevated Price Risk Amid Strong Returns
Assam Entrade Ltd, a micro-cap player in the Non Banking Financial Company (NBFC) sector, has seen its valuation parameters shift markedly, moving from fair to very expensive territory. Despite a robust one-year return of 36.5%, the stock’s elevated price-to-earnings and enterprise value multiples raise questions about its price attractiveness relative to peers and historical benchmarks.
Read More
Assam Entrade Ltd is Rated Sell
Assam Entrade Ltd is rated 'Sell' by MarketsMOJO, with this rating last updated on 01 Apr 2026. However, the analysis and financial metrics discussed here reflect the stock's current position as of 05 May 2026, providing investors with the latest insights into the company’s performance and outlook.
Read More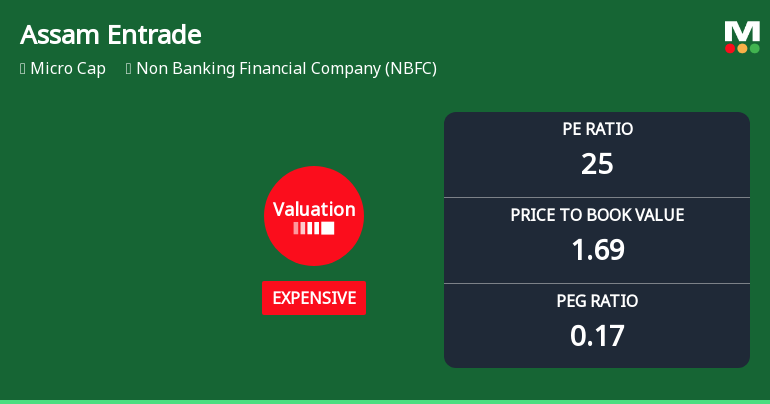
Assam Entrade Ltd Valuation Shifts Signal Price Attractiveness Challenges
Assam Entrade Ltd, a micro-cap player in the Non Banking Financial Company (NBFC) sector, has seen a notable shift in its valuation parameters, moving from fair to expensive territory. This change, reflected in its price-to-earnings (P/E) and price-to-book value (P/BV) ratios, raises questions about the stock's price attractiveness relative to its historical averages and peer group. Despite recent gains, investors should carefully analyse the evolving valuation landscape before making decisions.
Read More Announcements
Announcement under Regulation 30 (LODR)-Newspaper Publication
01-Jun-2026 | Source : BSENewspaper clippings of Audited Financial results for the quarter and year ended 31.03.2026
Compliances-Reg.24(A)-Annual Secretarial Compliance
30-May-2026 | Source : BSEAnnual Secretarial Compliance report for the year ended 31.03.2026
Board Meeting Outcome for Outcome Of Board Meeting Held On 30.05.2026.
30-May-2026 | Source : BSEAudited Financial Results (Standalone and Consolidated) along with Auditors Report and declaration(s) under Regulation 33(3)(d) of SEBI (LODR) Regulations 2015 for the quarter and financial year ended 31.03.2026.
Corporate Actions

No Upcoming Board Meetings

No Dividend history available

No Splits history available

No Bonus history available

No Rights history available
Quality key factors
Valuation key factors
Technicals key factors
 Technical Indicator Scale: Bearish, Mildly Bearish, Sideways, Mildly Bullish, Bullish Turned
 Shareholding Snapshot : Dec 2025
Shareholding Compare (%holding)
Promoters
None
Held by 0 Schemes
Held by 0 FIIs
Dharam Portfolio Private Limited (9.28%)
Shiv Kumar Gupta (8.37%)
35.4%
Quarterly Results Snapshot (Consolidated) - Mar'26 - QoQ

QoQ Growth in quarter ended Mar 2026 is -10.78% vs 16.00% in Dec 2025
QoQ Growth in quarter ended Mar 2026 is -137.76% vs 24,200.00% in Dec 2025
Half Yearly Results Snapshot (Consolidated) - Sep'25
Growth in half year ended Sep 2025 is -14.01% vs 27.19% in Sep 2024
Growth in half year ended Sep 2025 is -76.00% vs 471.43% in Sep 2024
Nine Monthly Results Snapshot (Consolidated) - Dec'25
YoY Growth in nine months ended Dec 2025 is -9.31% vs 29.19% in Dec 2024

YoY Growth in nine months ended Dec 2025 is 114.07% vs 62.65% in Dec 2024
Annual Results Snapshot (Consolidated) - Mar'26
YoY Growth in year ended Mar 2026 is -6.32% vs 17.61% in Mar 2025
YoY Growth in year ended Mar 2026 is -34.77% vs 125.37% in Mar 2025
About Assam Entrade Ltd

Company Coordinates