Dashboard
Low ability to service debt as the company has a high Debt to EBITDA ratio of 13.71 times
- Poor long term growth as Net Sales has grown by an annual rate of 10.20% over the last 5 years
- Low ability to service debt as the company has a high Debt to EBITDA ratio of 13.71 times
- The company has been able to generate a Return on Equity (avg) of 1.23% signifying low profitability per unit of shareholders funds
Healthy long term growth as Operating profit has grown by an annual rate 371.95%
With a growth in Operating Profit of 178.64%, the company declared Very Positive results in Mar 26
With ROE of 7.4, it has a Very Attractive valuation with a 1.4 Price to Book Value
Increasing Participation by Institutional Investors
Stock DNA
Trading & Distributors
INR 972 Cr (Micro Cap)
18.00
23
0.00%
-0.18
0.81%
1.32
Total Returns (Price + Dividend) 
Arisinfra Solu. for the last several years.
Risk Adjusted Returns v/s
Returns Beta

News
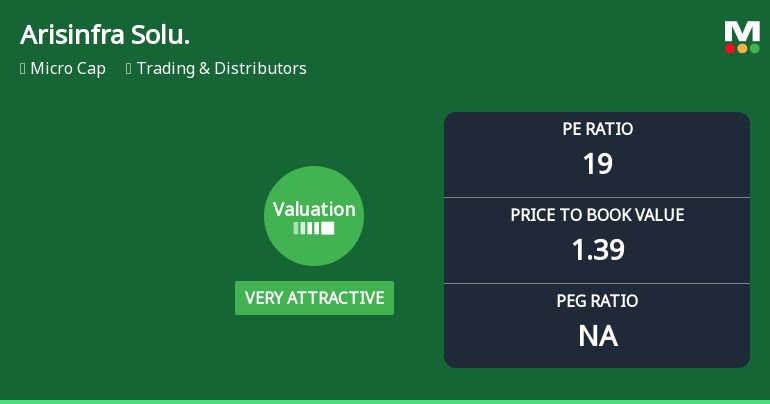
Arisinfra Solutions Ltd Valuation Turns Very Attractive Amid Market Volatility
Arisinfra Solutions Ltd has witnessed a significant shift in its valuation parameters, moving from an attractive to a very attractive grade, despite a recent sharp decline in its share price. This change reflects improved price-to-earnings and price-to-book value ratios relative to its historical averages and peer group, positioning the micro-cap stock as a compelling opportunity within the Trading & Distributors sector.
Read More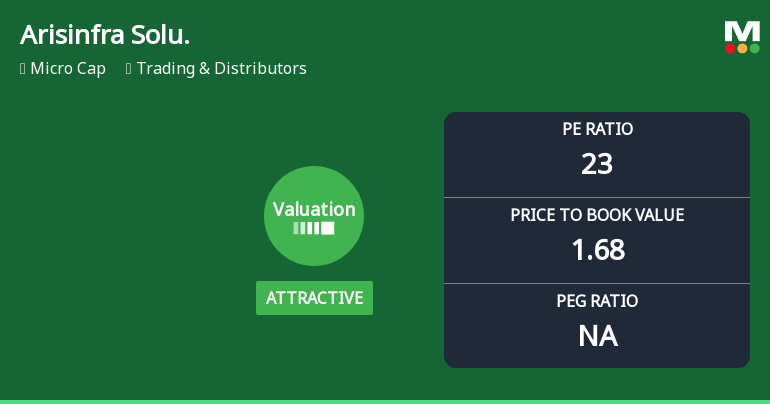
Arisinfra Solutions Ltd Valuation Shifts Signal Renewed Price Attractiveness
Arisinfra Solutions Ltd has undergone a significant valuation transformation, moving from a very expensive rating to an attractive valuation grade. This shift, coupled with a recent upgrade in its Mojo Grade from Sell to Buy, highlights a compelling opportunity for investors seeking value in the Trading & Distributors sector.
Read More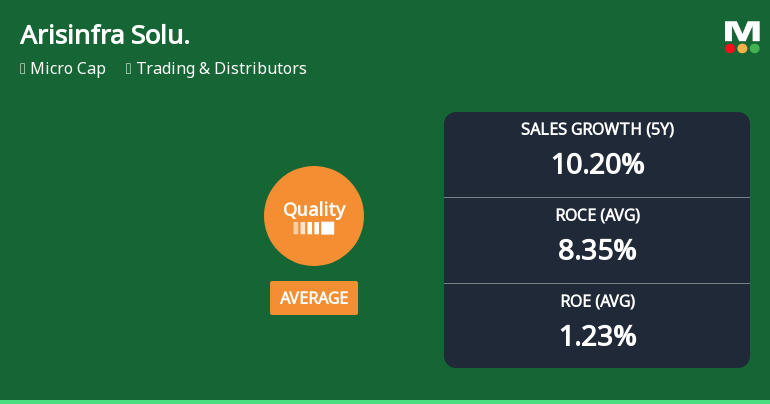
Arisinfra Solutions Ltd Upgrades Quality Grade Amidst Mixed Fundamental Signals
Arisinfra Solutions Ltd has seen its quality grade upgraded from below average to average, reflecting notable improvements in earnings growth and operational efficiency despite persistent challenges in return ratios and leverage. The micro-cap trading and distributors company’s recent fundamental review highlights a complex picture of progress and areas requiring caution for investors.
Read More Announcements
Disclosures under Reg. 29(2) of SEBI (SAST) Regulations 2011
12-Jun-2026 | Source : BSEThe Exchange has received the disclosure under Regulation 29(2) of SEBI (Substantial Acquisition of Shares & Takeovers) Regulations 2011 for Shivanand Shankar Mankekar HUF & PACs
Announcement under Regulation 30 (LODR)-Analyst / Investor Meet - Intimation
08-Jun-2026 | Source : BSEPursuant to Regulation 30 of the SEBI (Listing Obligations and Disclosure Requirements) Regulations 2015 as amended we would like to inform you that officials of the Company will be participating in the conference Valorem CXO Meet on June 12 2026 at 4 p.m.
Compliances-Reg.24(A)-Annual Secretarial Compliance
19-May-2026 | Source : BSESubmission of Annual Secretarial Compliance Report for Financial Year ended March 31 2026
Corporate Actions

No Upcoming Board Meetings

No Dividend history available

No Splits history available

No Bonus history available

No Rights history available
Quality key factors
Valuation key factors
Technicals key factors
 Technical Indicator Scale: Bearish, Mildly Bearish, Sideways, Mildly Bullish, Bullish Turned
 Shareholding Snapshot : Mar 2026
Shareholding Compare (%holding)
Non Institution
None
Held by 0 Schemes
Held by 8 FIIs (2.08%)
Aspire Family Trust (jasmine Bhaskar Shah) (8.72%)
Neomile Growth Fund - Series I (5.72%)
36.97%
Quarterly Results Snapshot (Consolidated) - Mar'26 - QoQ

QoQ Growth in quarter ended Mar 2026 is 26.78% vs 12.29% in Dec 2025
QoQ Growth in quarter ended Mar 2026 is 29.84% vs 6.93% in Dec 2025
Half Yearly Results Snapshot (Standalone) - Sep'25
Not Applicable: The company has declared_date for only one period
Not Applicable: The company has declared_date for only one period
Nine Monthly Results Snapshot (Standalone) - Dec'25
Not Applicable: The company has declared_date for only one period
Not Applicable: The company has declared_date for only one period
Annual Results Snapshot (Consolidated) - Mar'26
YoY Growth in year ended Mar 2026 is 39.05% vs 10.16% in Mar 2025
YoY Growth in year ended Mar 2026 is 2,445.89% vs 111.12% in Mar 2025
About Arisinfra Solutions Ltd

Company Coordinates