Dashboard
Low Debt Company with Strong Long Term Fundamental Strength
- Healthy long term growth as Net Sales has grown by an annual rate of 29.80% and Operating profit at 44.32%
- Company has a low Debt to Equity ratio (avg) at 0 times
- The company has been able to generate a Return on Capital Employed (avg) of 31.00% signifying high profitability per unit of total capital (equity and debt)
The company declared positive results in Mar'26 after negative results in Dec'25
Increasing Participation by Institutional Investors
Stock DNA
Pharmaceuticals & Biotechnology
INR 44,774 Cr (Large Cap)
71.00
34
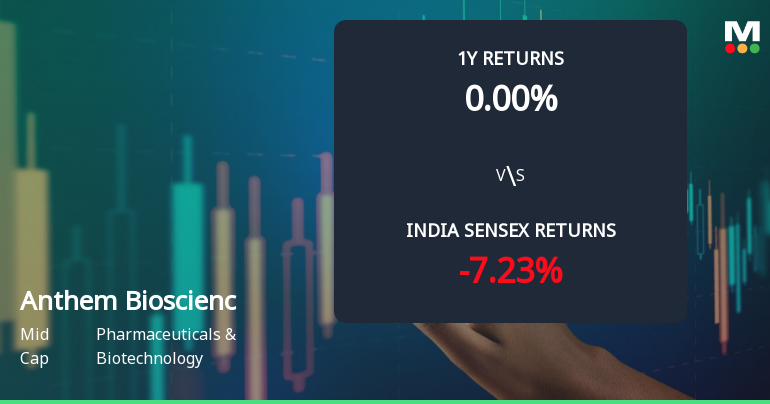
0.00%
-0.34
17.74%
13.59
Total Returns (Price + Dividend) 
Anthem Bioscienc for the last several years.
Risk Adjusted Returns v/s
Returns Beta

News
Anthem Biosciences Ltd Technical Momentum Shifts to Mildly Bullish Amid Mixed Market Returns
Anthem Biosciences Ltd, a mid-cap player in the Pharmaceuticals & Biotechnology sector, has experienced a notable shift in its technical momentum, moving from a mildly bearish to a mildly bullish trend. Despite a recent day decline of 0.87%, the stock’s technical indicators reveal a complex picture of emerging strength tempered by caution, as investors weigh the implications of mixed signals from key momentum and volume metrics.
Read More
Golden Cross Forms in Anthem Biosciences Ltd — Mixed Technical Signals Cloud the Outlook
The 50-day moving average has crossed above the 200-day moving average for Anthem Biosciences Ltd, signalling a golden cross on 20 May 2026. Yet, the stock declined 0.87% on the day the cross formed, while monthly technical indicators remain inconclusive. This divergence between the moving averages and other signals calls for a nuanced analysis of the cross's reliability.
Read More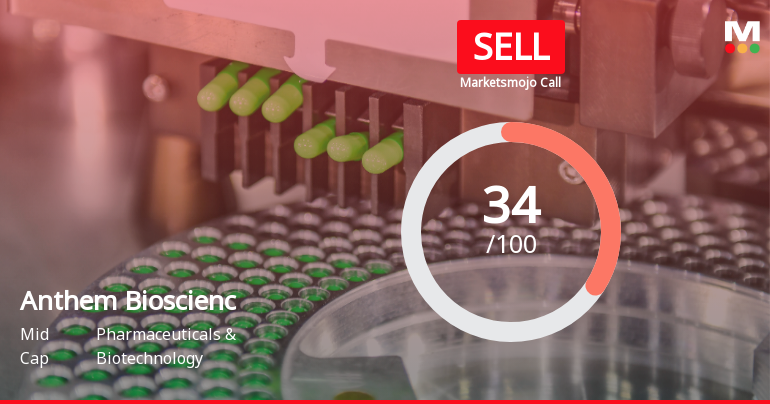
Anthem Biosciences Downgraded to Sell Amid Technical Weakness and Financial Setbacks
Anthem Biosciences Ltd, a mid-cap player in the Pharmaceuticals & Biotechnology sector, has seen its investment rating downgraded from Hold to Sell as of 18 May 2026. This shift reflects a combination of deteriorating technical indicators, disappointing quarterly financial results, and valuation concerns, despite some positive long-term fundamentals and institutional interest.
Read More Announcements
Announcement under Regulation 30 (LODR)-Analyst / Investor Meet - Intimation
05-Jun-2026 | Source : BSESchedule of Institutional Call to be held on June 10 2026
Announcement under Regulation 30 (LODR)-Earnings Call Transcript
22-May-2026 | Source : BSEEarnings Call transcript for Earnings Call held on May 20 2026 for the Audited Standalone and Consolidated financial results for the quarter and year ended March 31 2026.
Announcement under Regulation 30 (LODR)-Analyst / Investor Meet - Intimation
22-May-2026 | Source : BSEInvestors/Analyst Call Intimation to be schedule from June 02 2026 till June 05 2026.
Corporate Actions

No Upcoming Board Meetings

Anthem Biosciences Ltd has declared 100% dividend, ex-date: 25 Jun 26

No Splits history available

No Bonus history available

No Rights history available
Quality key factors
Valuation key factors
Technicals key factors
 Technical Indicator Scale: Bearish, Mildly Bearish, Sideways, Mildly Bullish, Bullish Turned
 Shareholding Snapshot : Mar 2026
Shareholding Compare (%holding)
Promoters
None
Held by 27 Schemes (10.12%)
Held by 37 FIIs (1.28%)
Ajay Bhardwaj (42.53%)
Portsmouth Technologies Llc . (2.74%)
9.38%
Quarterly Results Snapshot (Standalone) - Mar'26 - QoQ

QoQ Growth in quarter ended Mar 2026 is 39.83% vs -24.56% in Dec 2025
QoQ Growth in quarter ended Mar 2026 is 88.79% vs -43.50% in Dec 2025
Half Yearly Results Snapshot (Standalone) - Sep'25
Not Applicable: The company has declared_date for only one period
Not Applicable: The company has declared_date for only one period
Nine Monthly Results Snapshot (Standalone) - Dec'25
Not Applicable: The company has declared_date for only one period
Not Applicable: The company has declared_date for only one period
Annual Results Snapshot (Consolidated) - Mar'26

YoY Growth in year ended Mar 2026 is 15.17% vs 29.96% in Mar 2025
YoY Growth in year ended Mar 2026 is 31.14% vs 22.86% in Mar 2025
About Anthem Biosciences Ltd

Company Coordinates