Total Returns (Price + Dividend) 
AMS Polymers for the last several years.
Risk Adjusted Returns v/s
Returns Beta

News
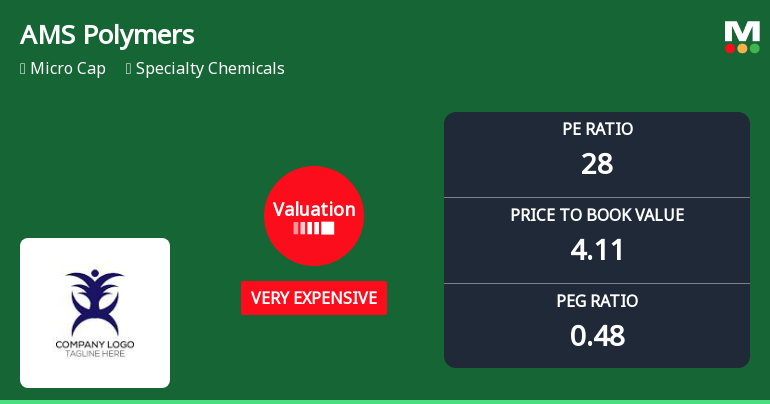
AMS Polymers Ltd Valuation Shifts Signal Elevated Price Risk Amid Strong Returns
AMS Polymers Ltd, a micro-cap player in the Specialty Chemicals sector, has seen a notable shift in its valuation parameters, moving from expensive to very expensive territory. Despite this, the stock has delivered exceptional returns year-to-date, significantly outperforming the Sensex. This article analyses the recent valuation changes, compares them with peer averages and historical benchmarks, and assesses the implications for investors.
Read More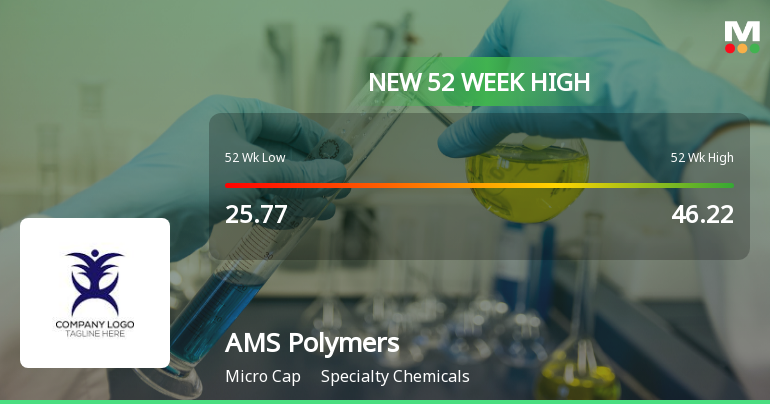
Broad-Based Technical Strength Lifts AMS Polymers Ltd to 52-Week High of Rs 81.46
Surging to an all-time high of Rs 81.46 on 29 Apr 2026, AMS Polymers Ltd has demonstrated remarkable momentum, rallying over 107% in just 15 trading sessions. This sustained uptrend is underpinned by a confluence of bullish technical indicators and a market environment that has favoured micro-cap specialty chemical stocks despite broader index pressures.
Read More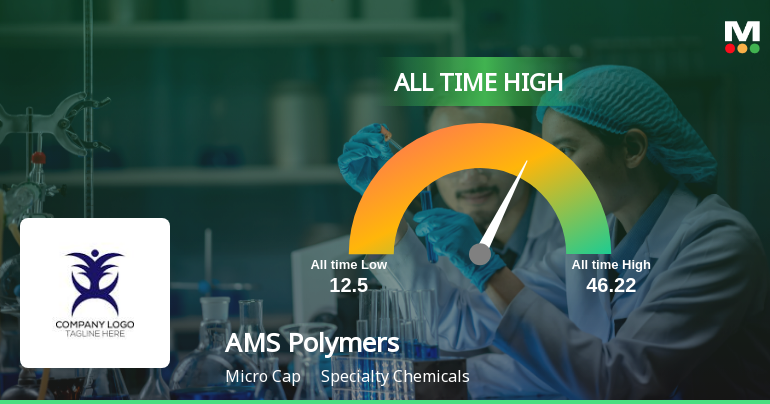
Announcements
Announcement under Regulation 30 (LODR)-Newspaper Publication
25-May-2026 | Source : BSENewspaper Publicaton of Audited Financial Results for the Quarter and year ended 31st March 2026
Non-Applicability Of Regulation 23(9) Of SEBI (Listing Obligations And Disclosure Requirements) 2015 For Quarter And Year Ended March 31 2026
23-May-2026 | Source : BSEThe disclosure related to related party transaction under regulation 23(9) of SEBI (LODR) Regulation 2015 is not applicable because neither paid up share capital nor net worth of the Company exceed the threshild limit.
Compliances-Reg.24(A)-Annual Secretarial Compliance
23-May-2026 | Source : BSEThe Paid Up capital of the Company is 33025000 and net worth is 60325040. Therefore Company is exempted for submitting Annual Secretarial Compliance Report for the financial year 2025-26.
Corporate Actions

No Upcoming Board Meetings

No Dividend history available

No Splits history available

No Bonus history available

No Rights history available
Quality key factors
Valuation key factors
Technicals key factors
 Technical Indicator Scale: Bearish, Mildly Bearish, Sideways, Mildly Bullish, Bullish Turned
 Shareholding Snapshot : Mar 2026
Shareholding Compare (%holding)
Non Institution
None
Held by 0 Schemes
Held by 0 FIIs
Anand Kumar (20.26%)
Vijay Kumar Agrawal (11.94%)
68.51%
Quarterly Results Snapshot (Standalone) - Mar'26 - YoY

YoY Growth in quarter ended Mar 2026 is 1.35% vs 55.79% in Mar 2025
YoY Growth in quarter ended Mar 2026 is -41.18% vs 1,800.00% in Mar 2025
Annual Results Snapshot (Standalone) - Mar'26
YoY Growth in year ended Mar 2026 is 8.56% vs 20.61% in Mar 2025
YoY Growth in year ended Mar 2026 is 2.60% vs 26.23% in Mar 2025


