Dashboard
High Management Efficiency with a high ROCE of 21.36%
Poor long term growth as Net Sales has grown by an annual rate of 12.20% over the last 5 years
Flat results in Mar 26
With ROE of 6.3, it has a Expensive valuation with a 2.5 Price to Book Value
Majority shareholders : Promoters
Stock DNA
Plastic Products - Industrial
INR 1,629 Cr (Small Cap)
42.00
36
0.00%
-0.14
7.95%
2.62
Total Returns (Price + Dividend) 
All Time Plastic for the last several years.
Risk Adjusted Returns v/s
Returns Beta

News
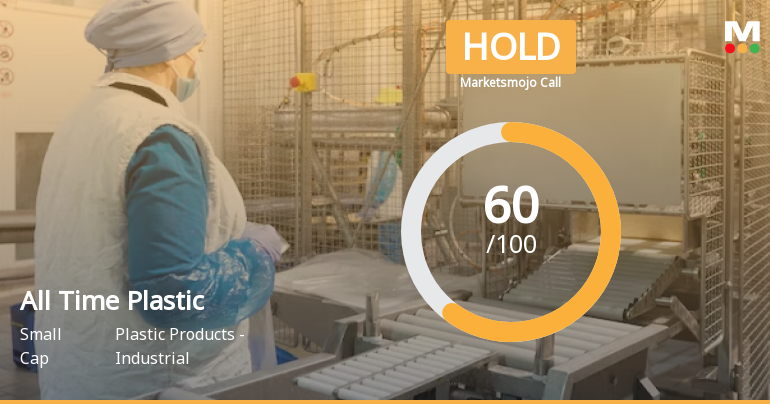
All Time Plastics Ltd is Rated Hold
All Time Plastics Ltd is rated 'Hold' by MarketsMOJO, with this rating last updated on 13 Apr 2026. However, the analysis and financial metrics discussed here reflect the stock's current position as of 06 May 2026, providing investors with an up-to-date view of the company’s performance and outlook.
Read More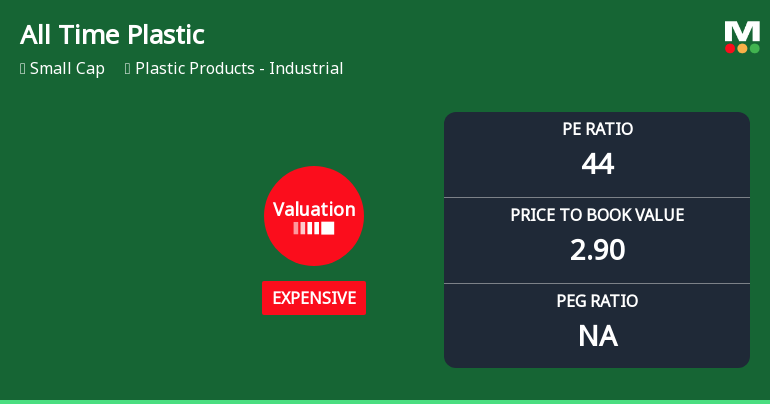
All Time Plastics Ltd Valuation Shifts Signal Changing Market Sentiment
All Time Plastics Ltd has witnessed a notable shift in its valuation parameters, moving from a fair to an expensive rating, reflecting evolving investor sentiment amid robust price gains and sector dynamics. This article analyses the recent changes in key valuation metrics, compares them with industry peers, and assesses the implications for investors navigating the plastic products industrial sector.
Read More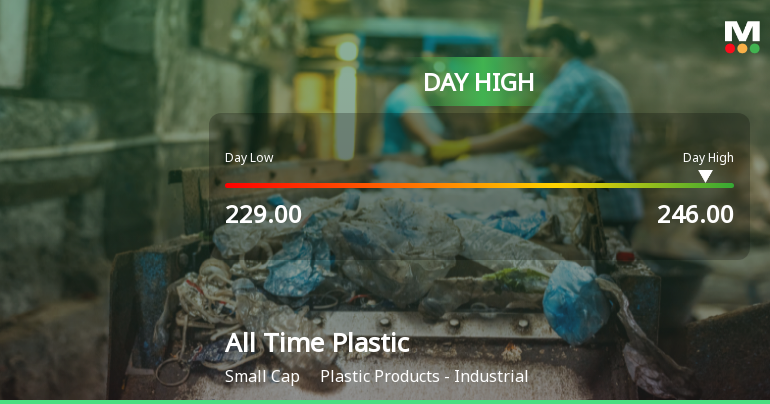
All Time Plastics Ltd Surges 7.69% to Day's High of Rs 246 — Outperforms Sector by 7.05 Percentage Points
The Sensex advanced 0.60% on 27 Apr 2026, yet All Time Plastics Ltd outpaced the broader market with a robust 7.69% gain, reaching an intraday high of Rs 246. This 7.05-percentage-point outperformance over its sector signals a distinctly stock-specific rally rather than a market-wide lift.
Read More Announcements
Clarification On Increase In Volume
16-Jun-2026 | Source : BSEWe hereby confirm that there are no such information/announcement (including impending announcement) which in the opinion of the Companys authorised KMP is due and required to be disclosed to the stock exchanges pursuant to Regulation 30 of the SEBI LODR regulations.
Clarification sought from All Time Plastics Ltd
16-Jun-2026 | Source : BSEThe Exchange has sought clarification from All Time Plastics Ltd on June 16 2026 with reference to Movement in Volume.
The reply is awaited.
Announcement under Regulation 30 (LODR)-Analyst / Investor Meet - Intimation
10-Jun-2026 | Source : BSEAnalyst / Investor meeting to be held on Tuesday June 16 2026
Corporate Actions

No Upcoming Board Meetings

No Dividend history available

No Splits history available

No Bonus history available

No Rights history available
Quality key factors
Valuation key factors
Technicals key factors
 Technical Indicator Scale: Bearish, Mildly Bearish, Sideways, Mildly Bullish, Bullish Turned
 Shareholding Snapshot : Mar 2026
Shareholding Compare (%holding)
Promoters
None
Held by 3 Schemes (2.27%)
Held by 6 FIIs (2.93%)
Bhupesh Punamchand Shah (23.33%)
Abakkus Four2eight Opportunities Fund (6.16%)
12.45%
Quarterly Results Snapshot (Standalone) - Mar'26 - QoQ

QoQ Growth in quarter ended Mar 2026 is -8.50% vs 8.07% in Dec 2025
QoQ Growth in quarter ended Mar 2026 is 2.62% vs 117.06% in Dec 2025
Half Yearly Results Snapshot (Standalone) - Sep'25
Not Applicable: The company has declared_date for only one period
Not Applicable: The company has declared_date for only one period
Nine Monthly Results Snapshot (Standalone) - Dec'25
Not Applicable: The company has declared_date for only one period
Not Applicable: The company has declared_date for only one period
Annual Results Snapshot (Standalone) - Mar'26

YoY Growth in year ended Mar 2026 is 9.36% vs 8.84% in Mar 2025
YoY Growth in year ended Mar 2026 is -24.74% vs 5.60% in Mar 2025
About All Time Plastics Ltd

Company Coordinates