Dashboard
Weak Long Term Fundamental Strength with a -1.80% CAGR growth in Operating Profits over the last 5 years
- Company's ability to service its debt is weak with a poor EBIT to Interest (avg) ratio of 1.25
- The company has been able to generate a Return on Equity (avg) of 7.49% signifying low profitability per unit of shareholders funds
With a fall in Net Sales of -18.91%, the company declared Very Negative results in Mar 26
Stock is technically in a Mildly Bearish range
60.13% of Promoter Shares are Pledged
Stock DNA
Construction
INR 11,815 Cr (Small Cap)
38.00
47
0.00%
0.52
9.32%
2.16
Total Returns (Price + Dividend) 
Afcons Infrastr. for the last several years.
Risk Adjusted Returns v/s
Returns Beta

News
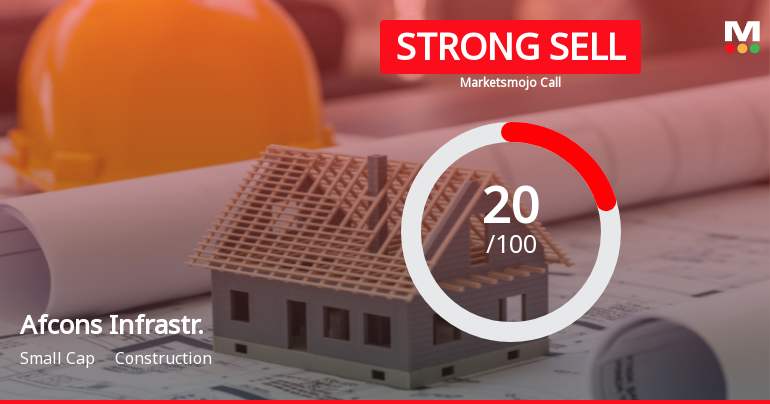
Afcons Infrastructure Ltd Downgraded to Strong Sell Amid Weak Financials and Bearish Trends
Afcons Infrastructure Ltd has been downgraded from a Sell to a Strong Sell rating following a comprehensive reassessment of its financial health, valuation, quality metrics, and technical indicators. The downgrade reflects a sharp deterioration in quarterly financial performance, weakening operational metrics, and a bearish technical outlook, despite an increasingly attractive valuation.
Read More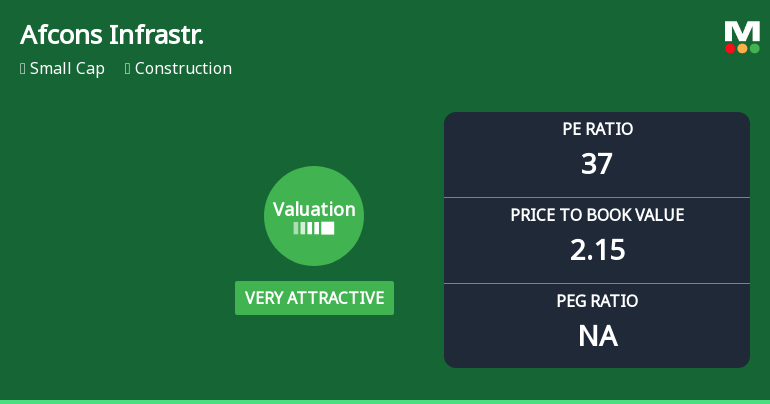
Afcons Infrastructure Ltd Valuation Shifts Signal Renewed Price Attractiveness
Afcons Infrastructure Ltd has seen a notable shift in its valuation parameters, moving from an attractive to a very attractive rating despite ongoing market headwinds and a challenging sector environment. This change reflects a significant reappraisal of the stock’s price multiples relative to its historical averages and peer group, offering investors a fresh perspective on its price attractiveness amid subdued returns and sector volatility.
Read More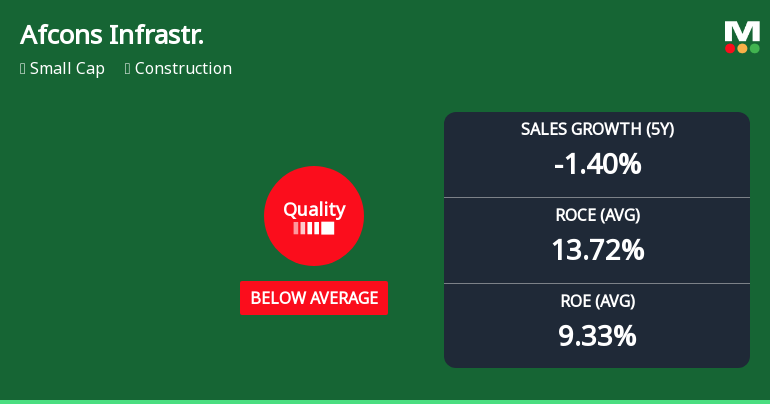
Afcons Infrastructure Ltd Downgraded to Strong Sell Amid Deteriorating Quality Metrics
Afcons Infrastructure Ltd has seen a marked deterioration in its business fundamentals, prompting a downgrade from Sell to Strong Sell by MarketsMOJO on 19 May 2026. The construction company’s quality parameters have shifted from average to below average, reflecting weakening profitability, growth, and leverage metrics that raise concerns for investors amid a challenging sector environment.
Read More Announcements
Announcement under Regulation 30 (LODR)-Award_of_Order_Receipt_of_Order
09-Jun-2026 | Source : BSEPress Release- Afcons awarded landmark Breakwater project for Vadhvan Port. The Project award value of Rs. 5301 Crores
Announcement under Regulation 30 (LODR)-Issue of Securities
04-Jun-2026 | Source : BSEPlease find enclosed intimation under Regulation 30 of SEBI (LODR) Regulations 2015 with respect to issuance of commercial paper.
Compliances-Reg.24(A)-Annual Secretarial Compliance
28-May-2026 | Source : BSEPlease find enclosed Annual Secretarial Compliance Report for the year ended March 31 2026
Corporate Actions

No Upcoming Board Meetings

No Dividend history available

No Splits history available

No Bonus history available

No Rights history available
Quality key factors
Valuation key factors
Technicals key factors
 Technical Indicator Scale: Bearish, Mildly Bearish, Sideways, Mildly Bullish, Bullish Turned
 Shareholding Snapshot : Mar 2026
Shareholding Compare (%holding)
Promoters
60.1292
Held by 25 Schemes (18.6%)
Held by 83 FIIs (12.19%)
Goswami Infratech Private Limited (25.03%)
Sbi Small Cap Fund (4.85%)
6.61%
Quarterly Results Snapshot (Consolidated) - Mar'26 - QoQ

QoQ Growth in quarter ended Mar 2026 is -12.16% vs -0.42% in Dec 2025
QoQ Growth in quarter ended Mar 2026 is -191.05% vs -7.89% in Dec 2025
Half Yearly Results Snapshot (Consolidated) - Sep'25

Growth in half year ended Sep 2025 is 4.00% vs -6.02% in Sep 2024
Growth in half year ended Sep 2025 is 6.81% vs 16.33% in Sep 2024
Nine Monthly Results Snapshot (Consolidated) - Dec'25
YoY Growth in nine months ended Dec 2025 is 0.10% vs -3.18% in Dec 2024
YoY Growth in nine months ended Dec 2025 is -9.66% vs 23.29% in Dec 2024
Annual Results Snapshot (Consolidated) - Mar'26
YoY Growth in year ended Mar 2026 is -4.78% vs -5.42% in Mar 2025
YoY Growth in year ended Mar 2026 is -48.34% vs 8.24% in Mar 2025
About Afcons Infrastructure Ltd

Company Coordinates