Dashboard
High Management Efficiency with a high ROE of 47.09%
Company has a low Debt to Equity ratio (avg) at 0 times
Healthy long term growth as Operating profit has grown by an annual rate 31.97%
With a growth in Operating Profit of 62.55%, the company declared Very Positive results in Mar 26
With ROE of 18.8, it has a Attractive valuation with a 2.4 Price to Book Value
Majority shareholders : Promoters
Stock DNA
Computers - Software & Consulting
INR 241 Cr (Micro Cap)
12.00
21
0.00%
-0.38
14.46%
2.25
Total Returns (Price + Dividend) 
Adcounty Media. for the last several years.
Risk Adjusted Returns v/s
Returns Beta

News

Adcounty Media India Ltd Reports Very Positive Quarterly Financial Performance Amid Market Volatility
Adcounty Media India Ltd has delivered a very positive financial performance in the quarter ended March 2026, marking a significant improvement in key metrics such as revenue, profitability, and earnings per share. This robust quarterly showing contrasts with the company’s recent historical trends and comes amid a challenging market environment where the broader Sensex has struggled to maintain momentum.
Read More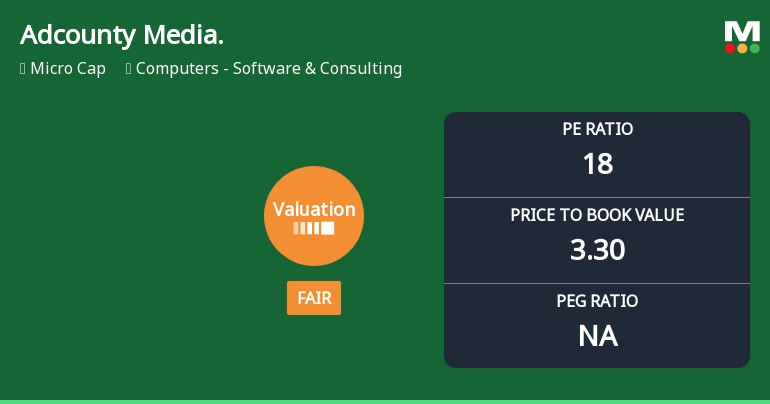
Adcounty Media India Ltd Valuation Shifts to Fair Amid Strong Price Gains
Adcounty Media India Ltd has witnessed a notable shift in its valuation parameters, moving from an attractive to a fair rating as its price multiples have expanded amid robust stock price gains. This recalibration reflects evolving market perceptions in the Computers - Software & Consulting sector, with the company’s price-to-earnings (P/E) and price-to-book value (P/BV) ratios now aligning more closely with peer averages, signalling a moderation in price attractiveness despite strong operational metrics.
Read More
Adcounty Media India Ltd is Rated Hold
Adcounty Media India Ltd is rated 'Hold' by MarketsMOJO, with this rating last updated on 08 April 2026. However, the analysis and financial metrics discussed here reflect the stock's current position as of 20 April 2026, providing investors with the latest insights into the company’s performance and outlook.
Read More Announcements
Announcement under Regulation 30 (LODR)-Newspaper Publication
27-May-2026 | Source : BSEPlease find enclosed copy of newspaper advertisement regarding notice of postal ballot and evoting to members.
Shareholder Meeting / Postal Ballot-Notice of Postal Ballot
26-May-2026 | Source : BSEWe hereby submit Notice of Postal Ballot of the Comany dated May 192026 together with the explanatory statement. Please refer attachment for details.
Board Meeting Outcome for Outcome Of Meeting Of The Board Of Directors Of Adcounty Media India Limited Held On May 192026
19-May-2026 | Source : BSEIn continuation of our intimation dated May 14 2026 we wish to inform you that the Board of Directors of the Company at its meeting held today i.e. Tuesday May 19 2026 has inter alia considered and approved the Audited Standalone and Consolidated Financial Results of the Company for the Quarter Half Year and Financial Year ended on March 31 2026 along with other agenda items as detailed in the attached outcome.
Corporate Actions

No Upcoming Board Meetings

No Dividend history available

No Splits history available

No Bonus history available

No Rights history available
Quality key factors
Valuation key factors
Technicals key factors
 Technical Indicator Scale: Bearish, Mildly Bearish, Sideways, Mildly Bullish, Bullish Turned
 Shareholding Snapshot : Mar 2026
Shareholding Compare (%holding)
Promoters
None
Held by 0 Schemes
Held by 3 FIIs (0.3%)
Innovana Thinklabs Limited (17.79%)
Ashish Kacholia (2.92%)
24.14%
Quarterly Results Snapshot (Standalone) - Mar'26 - QoQ

QoQ Growth in quarter ended Mar 2026 is 45.29% vs 24.55% in Dec 2025
QoQ Growth in quarter ended Mar 2026 is 21.99% vs 20.23% in Dec 2025
Half Yearly Results Snapshot (Standalone) - Sep'25

Growth in half year ended Sep 2025 is -13.42% vs 30.28% in Mar 2025
Growth in half year ended Sep 2025 is 15.91% vs 12.85% in Mar 2025
Nine Monthly Results Snapshot (Standalone) - Dec'25
Not Applicable: The company has declared_date for only one period
Not Applicable: The company has declared_date for only one period
Annual Results Snapshot (Standalone) - Mar'26
YoY Growth in year ended Mar 2026 is 23.03% vs 61.51% in Mar 2025
YoY Growth in year ended Mar 2026 is 45.89% vs 66.06% in Mar 2025
About Adcounty Media India Ltd

Company Coordinates